
In the Sales Dashboards section, you can view information such as general metrics, sales volume, approval by payment method, and best-selling plans.
This feature is useful for finding the main sales indicators captured in tracking within the Tracking Groups.
On this page:
-
General Metrics
-
Sales Volume
-
Approval by Payment Method
-
Best-Selling Plans
General Metrics
In the General Metrics section, you can observe the main sales indicators.
Steps:
1 - Select the list of Tracking Groups - a screen with the data will be displayed.
2 - In General Metrics, the list displays the following information:
-
Revenue(1): displays the total sum of sales made in the period;
-
Sales(1): displays the quantity of valid sales;
-
Products(2): displays the quantity of products (items) sold;
-
New Customers(3): displays the quantity of customers who had an approved sale in the period, of which this is the first sale registered in the account;
-
Refunds: displays the quantity, total value, and percentage of refunded sales.

(1) Already deducting the refunds made.
(2) Quantity of Products sold refers to the number of items to be delivered to the customer in the sale. Example: if you made 3 sales of a kit of 4 products, this corresponds to a total of 12 products.
(3) When applying the filter by specific group or product, the information about New Customers will display the new buyers of that product, which is not necessarily a new buyer, meaning a buyer can appear as new multiple times.
Sales Volume
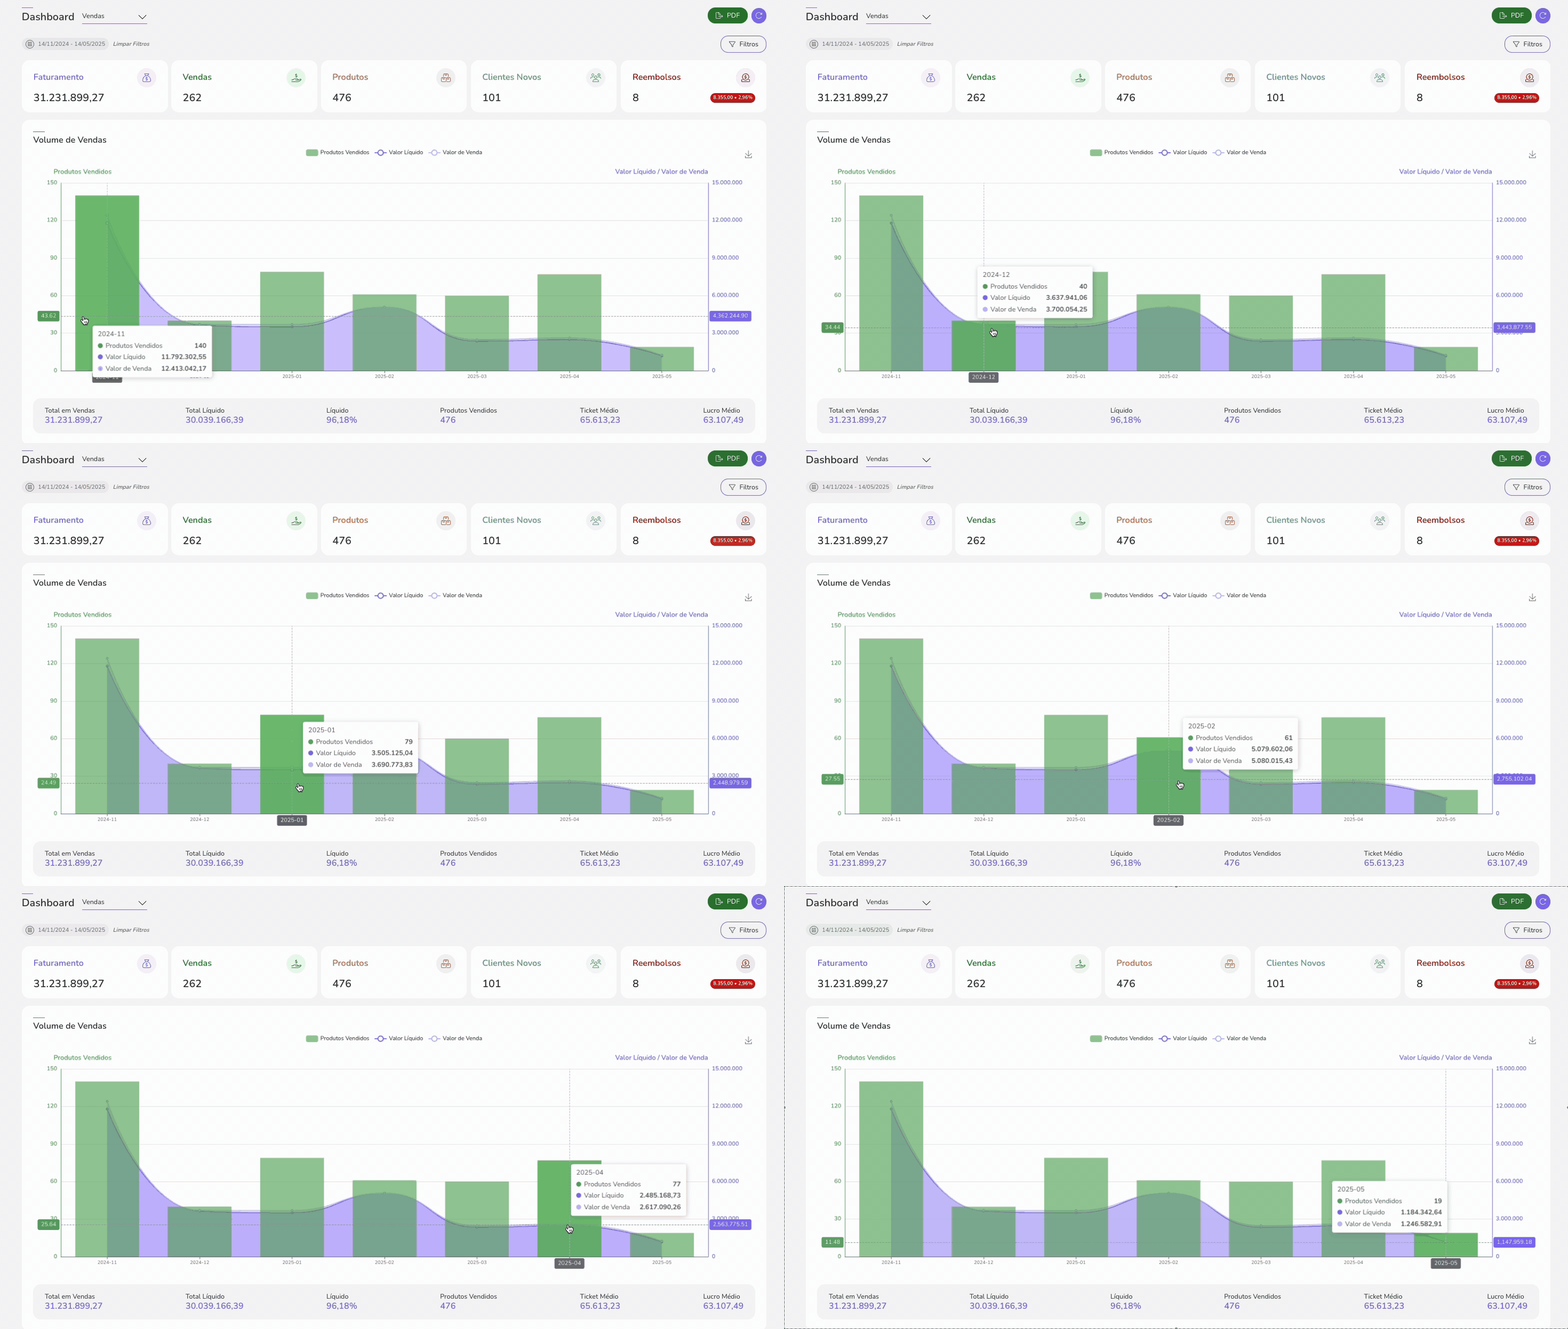
In the section Sales Volume, you can analyze the evolution of sales volume over a period. The information is presented in two ways.
Steps:
1 - Select the list of Tracking Groups - a screen with the data will be displayed.
2 - In Sales Volume, the list displays the following information:
Graph
The graph displays the variation in sales in terms of product quantity, net value, and sales value over a period that can be daily (for periods up to 31 days) or monthly (for periods over 31 days).
Performance indicators
-
Total sales: displays the total value of all sales made in the period;
-
Net total: displays the net total to receive, i.e., deducting affiliate commissions and marketplace fees(1);
-
Net percentage: displays the percentage of the net total of sales made in the period;
-
Products sold(2): displays the number of products sold in the period;
-
Average ticket(3): displays the average value of each sale in the period (total divided by the number of sales);
-
Average profit(4): informs the average profit of sales made in the period, dividing the net total by the number of sales.
(1) Considered in the calculation if the marketplace sends this information to Guru. If sent, these fees are also displayed in the sales detail.
(2) Quantity of Products sold refers to the number of items to be delivered to the customer in the sale. Example: it is possible to make 3 sales of a kit of 4 products, which will total 12 products.
(3) The average ticket is the result of dividing the total sales by the number of transactions within the selected period.
(4) To calculate the average profit, it is necessary to divide the net total by the number of sales.
Guru's Tip:
If desired, you can save the graph image: 
Approval By Payment Method
In the section Approval by payment method it is possible to consult the percentage and number of valid sales (payment confirmed) for each payment method used.
Steps:
1 - Select the list of Tracking Groups - a screen with the data will be displayed.
2 - In Approval by Payment Method, the list displays the following information:
-
Revenue(1): total sales of payment methods;
-
Credit Card(1): percentage of sales approved for credit.
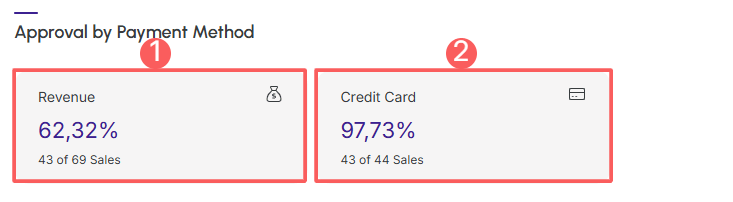
(1) The integer on the left is the total number of sales, and the one on the right is the number of approved sales.
By default, the results presented consider sales from the last 28 days. If the filter is changed, only sales that meet the filtering criteria are considered.
Best-Selling Plans
In the section Best-selling plans, it is possible to observe the ranking of best-selling products, where the top 10 products are represented.
Steps:
1 - Select the list of Tracking Groups - a screen with the data will be displayed.
2 - In Best-Selling Plans, the list displays the following information:
-
Name: displays the plan name;
-
Sales: displays the quantity of sales;
-
Products: displays the quantity of products sold(1);
-
Sales Total: displays the total sales value (gross revenue);
-
Affiliates Total: displays the total value of commission paid to affiliates;
-
Total Net Value: displays the total net value to be received (all expenses/comissions deducted);
-
Net Value: displays the percentage of the net total to be received.

Guru's Tip:
You can export the spreadsheet by clicking on the CSV.