
In the Forms Funnel within the P.P.C.T.s, you monitor the complete flow from click to sales conversion, having a clear view of each stage of the process. This tool gathers key indicators such as total cost, ROI, sales volume, and conversion metrics, providing fundamental insights for efficient management of your campaigns.
In Statistics, you view the consolidated performance of Sales P.P.C.T.s, ensuring transparency and control over each transaction.
Additionally, it is possible to apply precise filters (such as period and sales status) to easily segment the desired records. This simplifies specific analyses and helps you extract strategic insights quickly. Access to Sales by Hour and by Day of the Week, in addition to Approval by Payment Method, provide a directed view of products and the business.
With UTMs, you view specific tracking data if you have used these tags in your links. They form a set of parameters — such as utm_source, utm_medium, utm_campaign, utm_content e utm_term — that allow you to precisely track the origin of traffic, or the linked campaign, for example.
On this page:
-
Forms Funnel
-
Filter Sales P.P.C.T. Forms Funnel
-
Manage Sales P.P.C.T. Forms Funnel filters
-
-
Statistics
-
Sales by Hour / Days of the Week
-
Approval by Payment Method
-
Products
-
UTM
Forms Funnel
In the Forms Funnel, you can view all conversion funnel information and P.P.C.T. performance indicators. Additionally, you can use the filter to view a smaller subset of existing P.P.C.T.s. This feature is useful for finding specific P.P.C.T.s you want to view.
Steps:
1 - Select the Sales P.P.C.T. list - a screen with the data will be displayed.
2 - In Funnel, the list displays the following information:
-
Revenue: displays the total sum of sales made in the period;
-
Cost: displays the total campaign cost in the period;
-
ROI: displays the invested ROI of valid sales in the period;
-
Average Ticket1: displays the average value of each sale in the period (total divided by the number of sales);
-
CPV: displays the cost per sale;
-
CPC2: displays the cost per lead clicks in the period;
-
Ideal CPV (100% ROI)3: displays the ROI cost per ideal sale;
-
Ideal CPC: displays the ideal cost per click.
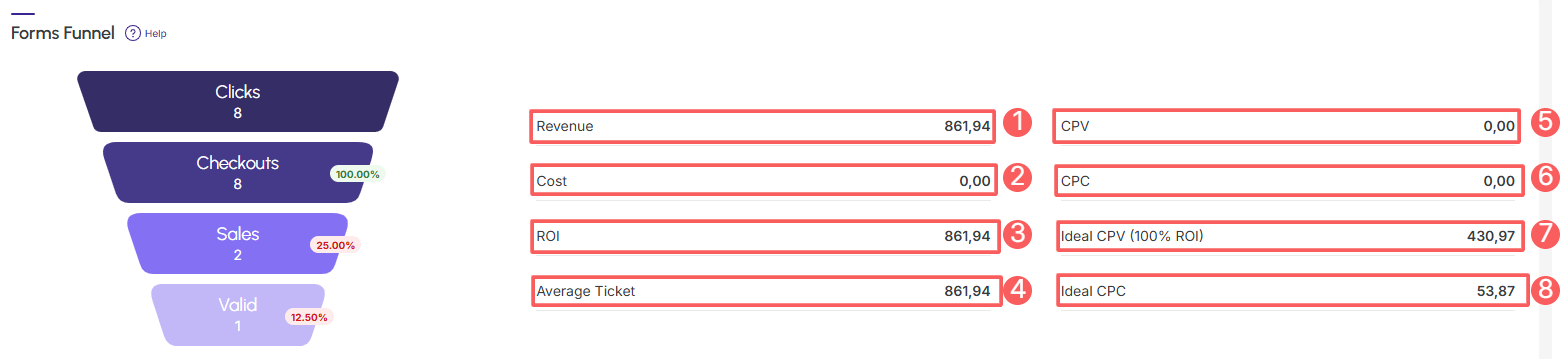
(1) The average ticket is the result of dividing the total sales by the number of transactions within the selected period.
(2) The CPC is calculated by dividing the total campaign cost by the number of clicks it generated).
(3) The Ideal CPV would be (ROI (invested value) x CPC (cost per lead).
Filter Sales P.P.C.T. funnel data
You can filter the data using the funnel.
By default, only records from the last 28 days will be shown, but the period can be changed in the filters, in the fields Start Date and End Date.
Steps:
1 - Select the Sales P.P.C.T. list - a screen with the data will be displayed.
2 - In Forms Funnel, click on Filters.
3 - Fill in one or more filter options:
-
Period: searches for sales with start and end dates - if desired, use the predefined time range buttons;
-
UTM Campaign: searches by the value of the UTM Campaign parameter passed in the P.P.C.T. link;
-
UTM Medium: searches by the value of the UTM Medium parameter passed in the P.P.C.T. link;
-
UTM Term: searches by the value of the UTM Term parameter passed in the P.P.C.T. link;
-
UTM Content: searches by the value of the UTM Content parameter passed in the P.P.C.T. link.
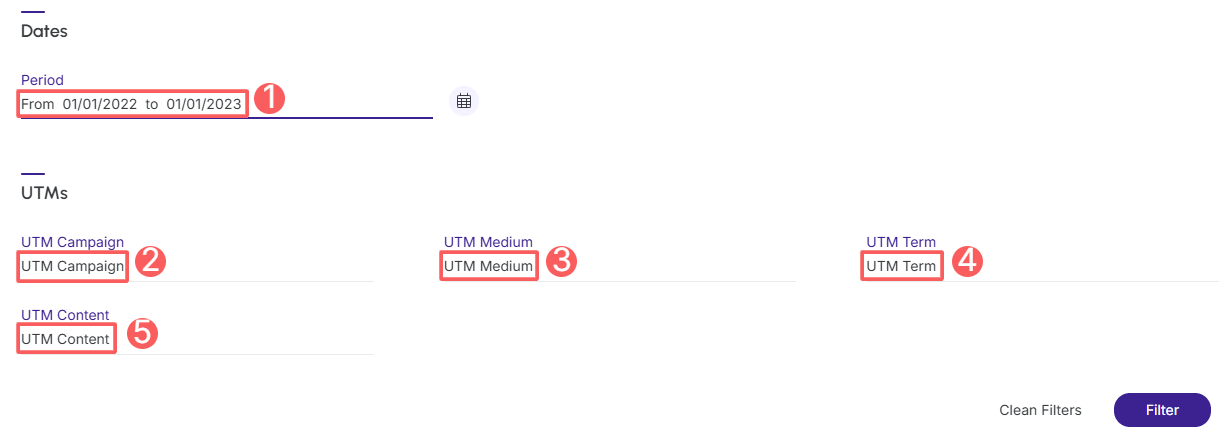
To remove the applied filters, just click on Clear Filters.
4 - Click on Filter.
Manage Sales P.P.C.T. Forms Funnel filters
You can check the number of applied filters when using filters to view desired information. This feature is useful if you want to check how many filters have been applied.
Additionally, it is possible to clear the filters without accessing the Filters icon again, facilitating the removal of applied filters.
View applied filters
You can check the number of applied filters.
Steps:
1 - Select the Sales P.P.C.T. list - a screen with the data will be displayed.
2 - In Forms Funnel, click on Filters.
3 - Fill in one or more filter options - apply the filters you want to view.
4 - Then, the number of applied filters will appear on the screen.
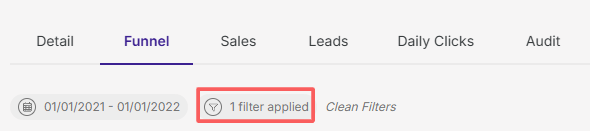
If you want to apply other filters, click Filter Leads P.P.C.T. Forms Funnel.
Clear applied filters
You can remove the applied filters without needing to click the filters icon.
Steps:
1 - Select the Sales P.P.C.T. list - a screen with the data will be displayed.
2 - In Forms Funnel, click on Filters.
3 - Fill in one or more filter options - apply the filters you want to view.
4 – Then, click on Clear Filters.
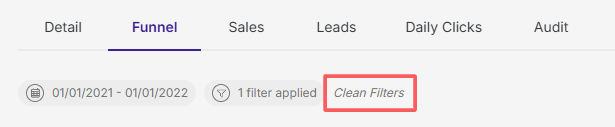
If you want to apply other filters, click Filter Leads P.P.C.T. Forms Funnel.
Statistics
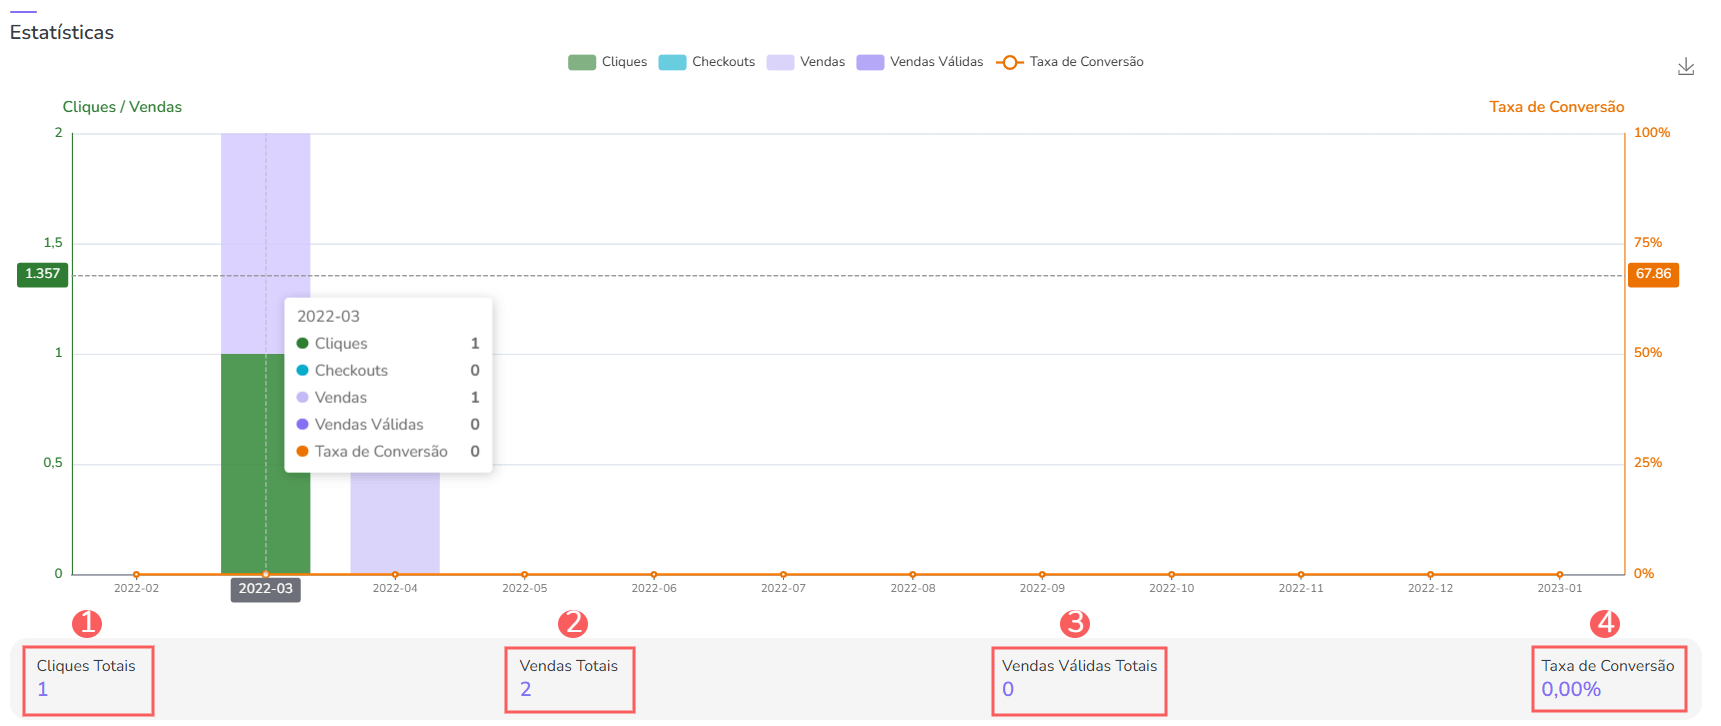
In the Statistics, you have a consolidated view of the main performance indicators related to your Sales P.P.C.T.s.
Steps:
1 - Select the Sales P.P.C.T. list - a screen with the data will be displayed.
2 - In Statistics, the list displays the following information:
-
Total Clicks: displays the total clicks of sales in the period;
-
Total Sales: displays the total sales registered in the period;
-
Total Valid Sales: displays the total valid sales registered in the period;
-
Conversion Rate: displays the conversion rate of tracked and completed sales in the period.
Sales by Hour
In the Sales by Hour a heat map is presented showing the days and hours of the day when new sales were made.
Through the graph, it is possible to know the best days and times for new sales.
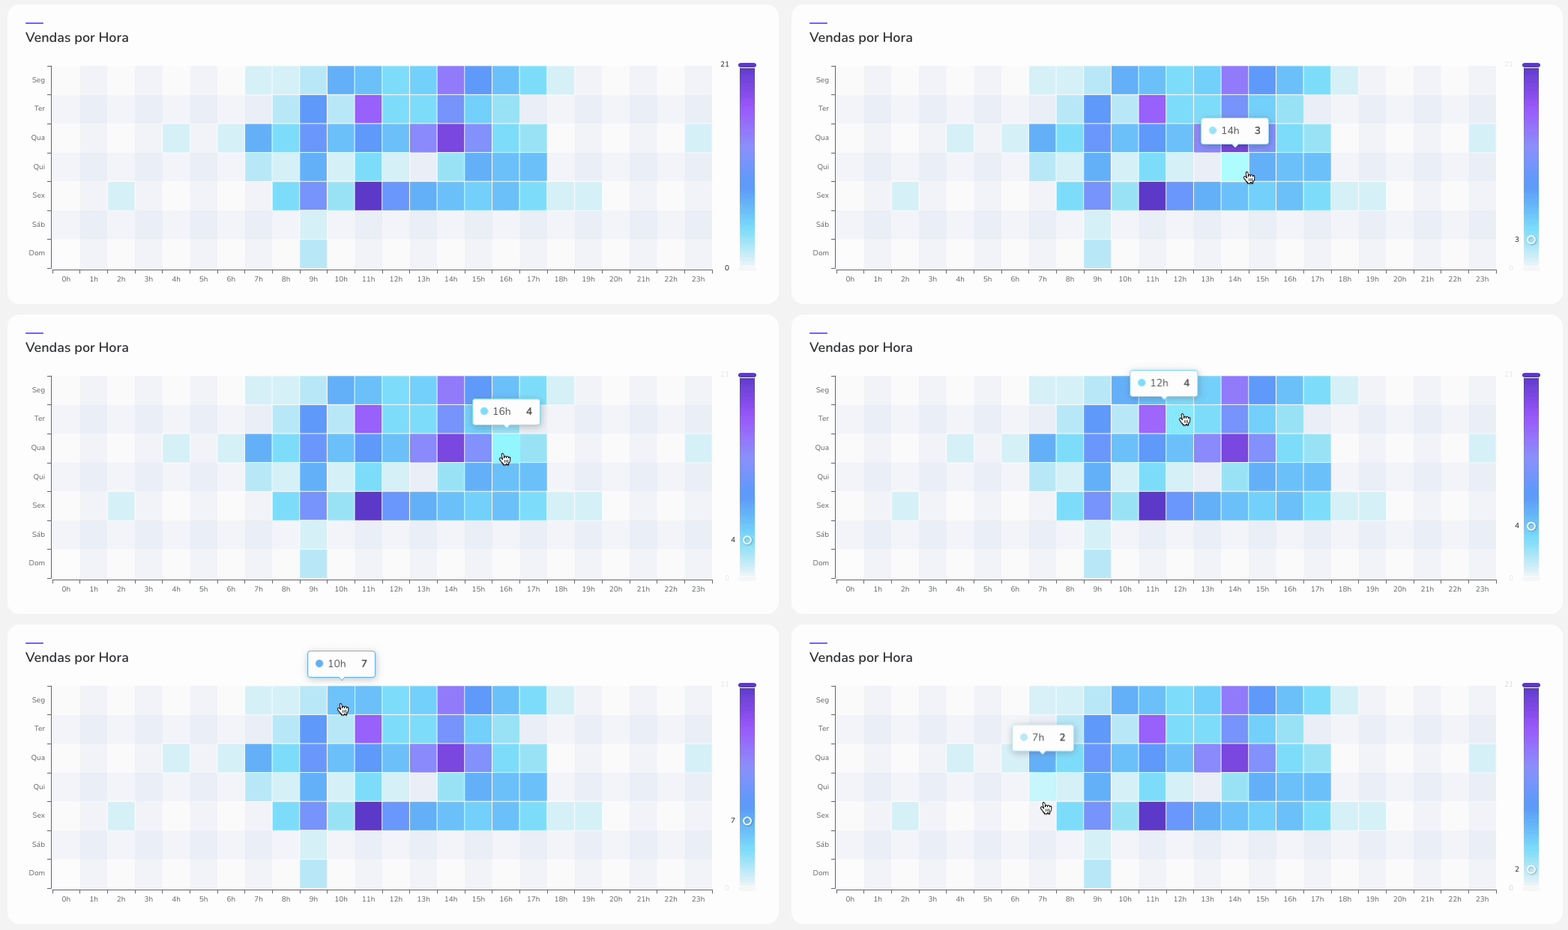
In this graph, subscription renewalsare not accounted for, as these occur at a scheduled time and would generate distortions in the graph.
By default, the presented results consider sales from the last 28 days. In case of filter alteration, only sales that meet the filtering criteria are considered.
Guru Tip: To know the volume of new sales for this period, hover your mouse over the square. The darker it is, the higher the volume of new sales.
Sales by days of the week
In the Sales by days of the week, it is possible to consult which days of the week generate the most sales.
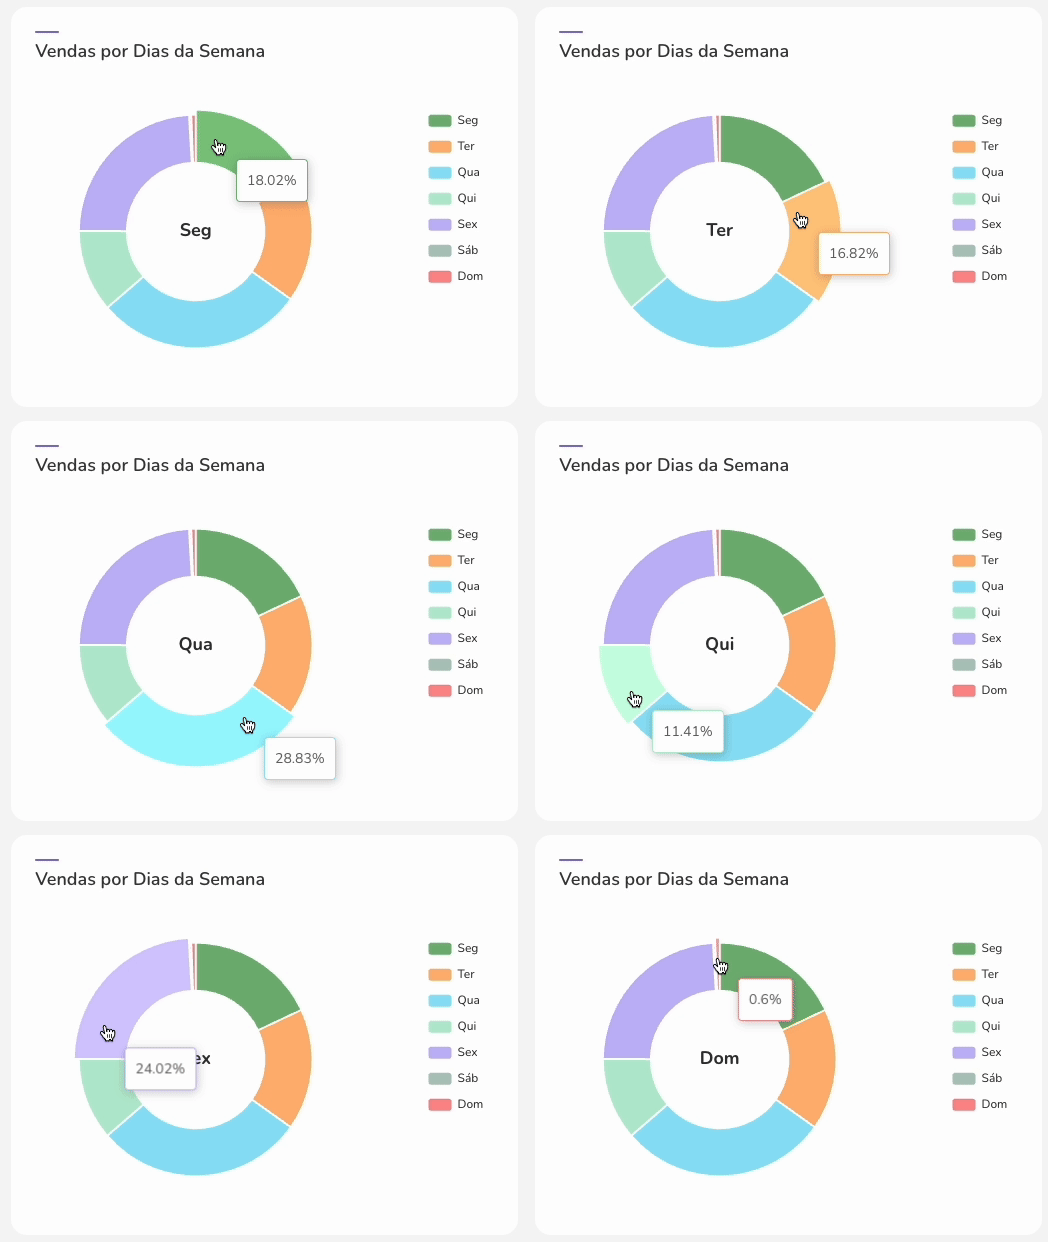
In this graph, subscription renewalsare not accounted for, as these occur at a scheduled time and would generate distortions in the graph.
By default, the presented results consider sales from the last 28 days. In case of filter alteration, only sales that meet the filtering criteria are considered.
Guru Tip: To know the volume of new sales for this period, hover your mouse over the square. The darker it is, the higher the volume of new sales.
Approval by Payment Method
In the Approval by payment method , it is possible to consult the percentage and number of valid sales (payment confirmed) for each payment method used.
Steps:
1 - Select the Sales P.P.C.T. list - a screen with the data will be displayed.
2 - In Approval by Payment Method, the list displays the following information:
-
Revenue(1): total sales from payment methods;
-
Credit Card(1): percentage of sales approved for credit.
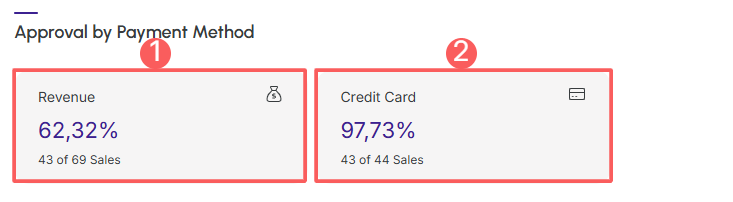
(1) The integer on the left is the total number of sales, and the one on the right is the number of approved sales.
In this graph, subscription renewals are not accounted for, as these occur at a scheduled time and would generate distortions in the graph.
By default, the presented results consider sales from the last 28 days. In case of filter alteration, only sales that meet the filtering criteria are considered.
Products
In the Products, it is possible to observe the relationship of products sold.
For each product, the following values are displayed:
-
Name: displays the product name;
-
Sales: displays the quantity of sales;
-
Products: displays the quantity of products sold(1);
-
Total Sales: displays the total sales value (gross revenue);
-
Total Affiliates: displays the total commission value paid to affiliates;
-
Total Net Revenue: displays the total net value to be received (after deducting all expenses/comissions);
-
Net Revenue: displays the percentage of the net total to be received.

Guru Tip:
You can export the spreadsheet by clicking on the CSV.
UTMs
In the UTMs, section, you can view the tracking information, if you have used UTMs in the tracking link. This feature is useful for finding specific P.P.C.T.s you want to view.
Steps:
1 - Select the Sales P.P.C.T. list - a screen with the data will be displayed.
2 - In UTMs, the list displays the following information:
-
UTMs: displays the value of the UTM parameter inserted in the URL - identifies where the traffic came from;
-
Clicks: displays the number of clicks for sales tracked in the period;
-
Checkouts: displays the number of checkouts completed in the period;
-
Sales: displays the number of sales completed in the period;
-
Valid: displays the number of valid sales completed in the period;
-
Revenue: displays the total revenue value in the period;
-
Cost: displays the cost value in the period;
-
CPC: displays the average cost per click for sales registered in the period;
-
ROI: displays the invested ROI of valid sales in the period.

(1) To calculate the total cost per lead (CPL), you need to sum all direct and indirect costs and divide by the total number of leads captured in a given period.
(2) Cpc is calculated by dividing the total campaign cost by the number of clicks it generated.
Guru's Tip:
You can export the spreadsheet by clicking on the CSV.