
The Subscriptions Dashboard - Trials presents an overview of subscriptions in trial period, allowing you to monitor trials started, converted, and ended, as well as analyze their distribution, the conversion type used, and upcoming trials to end.
With this data, it is possible to identify improvement opportunities in converting trials into paid subscriptions, understand the average time until subscription confirmation, and act proactively with subscribers whose trial period is about to end.
On this page:
-
Overview
-
Trials
-
Trial Distribution
-
Conversion Type
-
Trials to end
Overview
In the Overview section, you can observe the main key metrics related to trials in the selected period.
The data represents the status of trials, categorized as follows:
-
Started: indicates the number of subscriptions that started in the selected period;
-
Converted: indicates the number of trials that were converted into subscriptions in the selected period;
-
Average Conversion Time (in days): indicates the average time, in days, that customers take between starting the trial and confirming the first charge;
-
Awaiting Charge: indicates the number of ended trials waiting for a charge attempt to confirm the subscription;
-
Canceled: indicates the number of trial subscriptions canceled in the selected period.

With these metrics, you can monitor the trial funnel and identify improvement opportunities in conversion, as well as:
-
Started trials allow you to measure the volume of new interested prospects testing the product or service in the period;
-
Converted trials and average conversion time help evaluate offer effectiveness and conversion speed, besides identifying the best moment to reinforce communication with the subscriber - for this, you can use integrations with autoresponders and SMS to automate messaging during the trial period;
-
In trials pending charge, it is possible to track which subscriptions are awaiting first payment confirmation and act preventively - for this, you can send a reminder with the charge date, as well as guide the subscriber to confirm or update their payment method, anticipating eventual charging failures; and
-
Canceled trials analysis allows understanding the reasons leading a customer not to continue after the trial period and adjusting the recruitment strategy - you can cross-reference this data with the decline reasons per attempt in renewals, thus validating whether cancellation is related to a billing failure (involuntary churn) or subscriber cancellation (voluntary churn).
By default, the presented results consider subscriptions from the last 28 days.
To perform a detailed analysis of this and other sections of the Subscriptions Dashboard - Trials, you can export the data to a PDF file. In addition, you can apply a filter to receive the desired information.
Trials
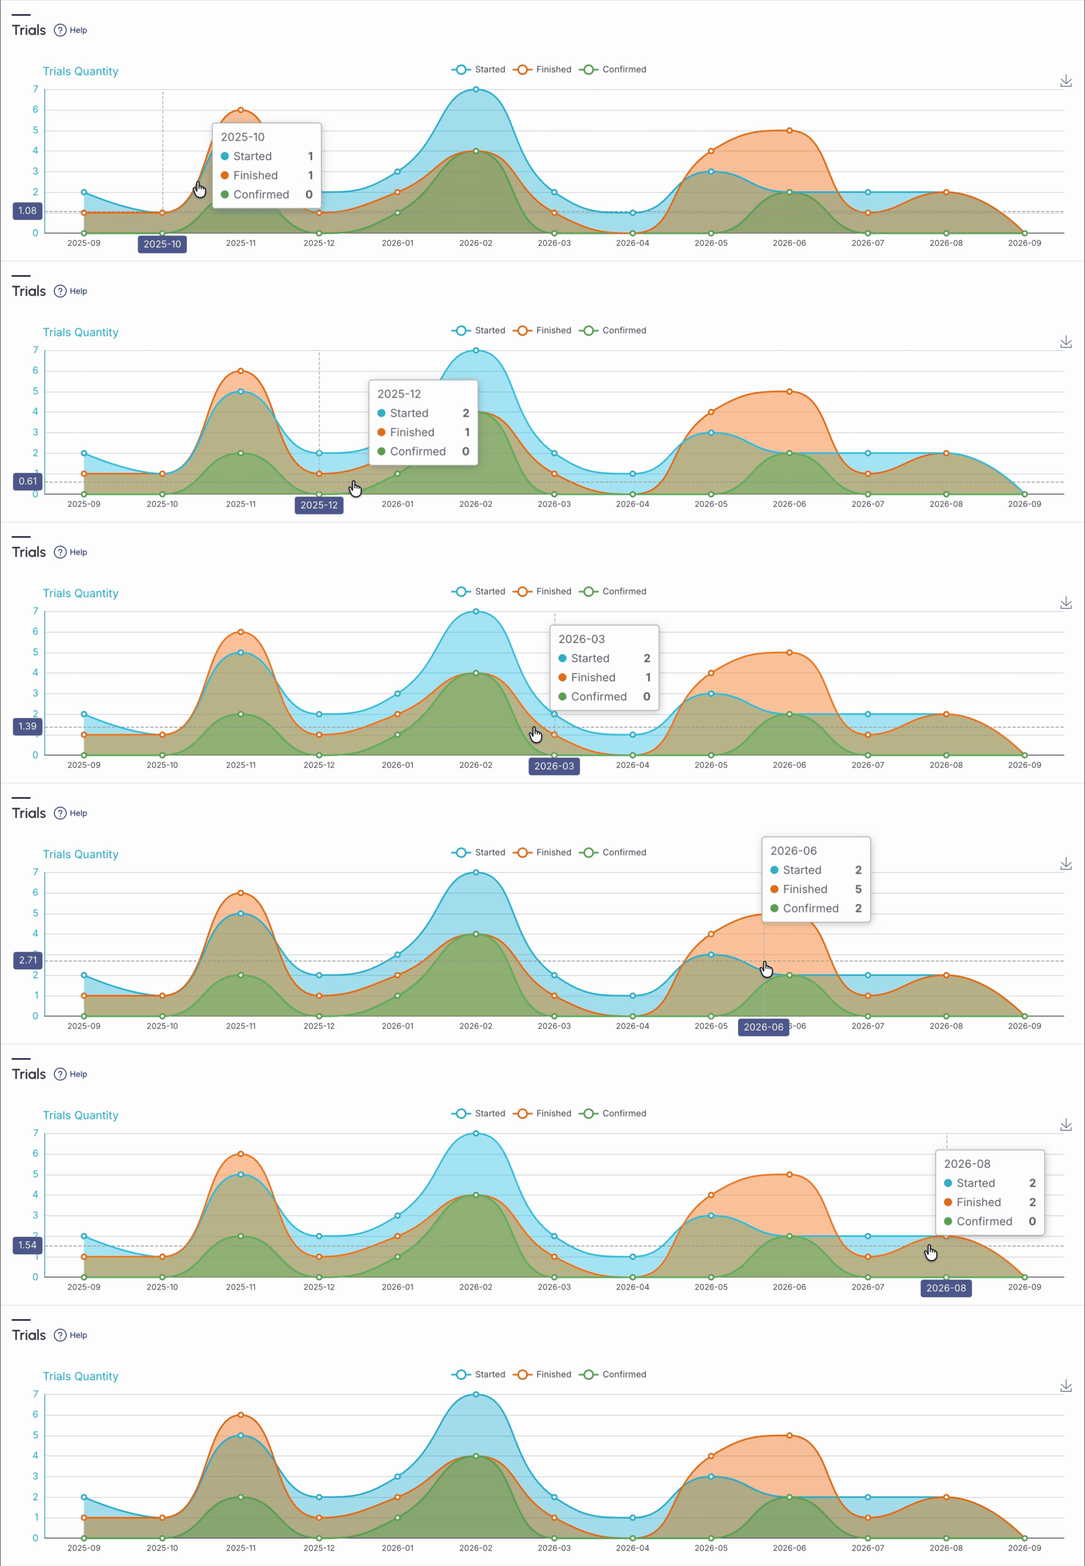
In the Trials section, the charts represent an overview of the trial quantity and conversion rate, indicating the number of started, ended, and confirmed trials.
Trial Quantity
The Trial Quantity chart represents the total number of test periods started by potential customers.
-
Trial started: displays those who started the subscription test period;
-
Trial ended: displays that the subscription trial has ended;
-
Trial confirmed: displays confirmation of the first subscription payment charge.
Conversion Rate
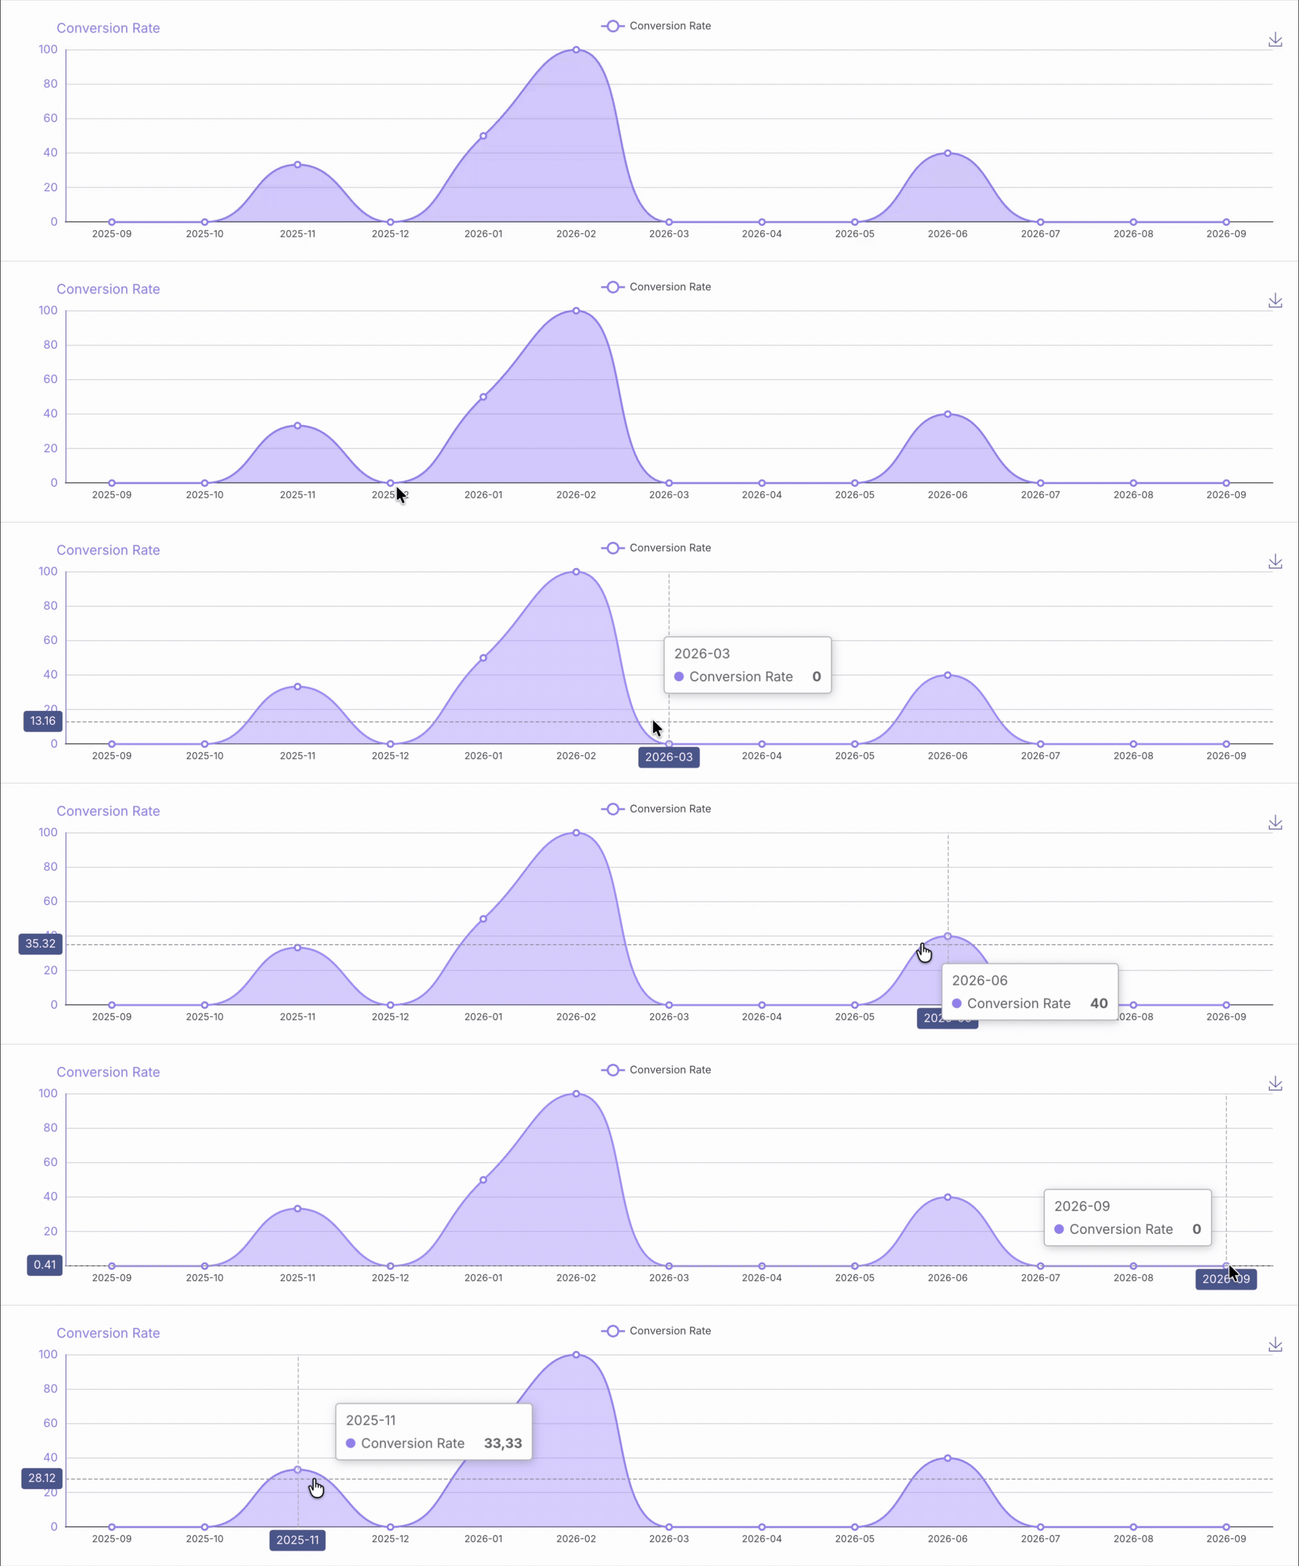
The conversion rate chart represents the relationship between trials with potential conversion and those that were effectively converted.
-
Possible: displays subscriptions eligible for renewal in the period;
-
Confirmed: displays confirmed subscriptions in the period;
-
Conversion rate: displays the conversion rate percentage in the period.
This calculation considers trials with conversion potential and confirmed trials, with the final result being the conversion percentage.
Strategic reading of trial data
The Trials Dashboard metrics allow tracking test period behavior and identifying opportunities to improve conversion into paid subscriptions. For this, you can consider:
-
The quantity of started and ended trials allows measuring the test funnel volume and tracking how many subscribers advance to the end of the trial period - a significant difference between these volumes may indicate that a relevant portion of subscribers is still in the trial period, especially when trials have different durations;
-
The conversion rate, when analyzed together with the volume of possible and confirmed trials, allows evaluating the effectiveness of the conversion process - lower rates may indicate the need to review onboarding, messaging during the test period, or perceived product value.
To complement this analysis, consider the average conversion time, which indicates how quickly subscribers usually confirm the first charge. By identifying the most recurring behavior, you can adjust the timing of communications and focus efforts on periods with higher conversion potential.
Guru Tip:
If you wish, you can save the chart images: 
By default, the presented results consider subscriptions from the last 28 days.
Trial distribution
In the Trial Distribution section, you can view, in a single chart, how trial subscriptions are distributed among different statuses - active, pending charge, converted and canceled.
-
Active: indicates the number of trials still within the test period;
-
Awaiting Charge: indicates the number of ended trials waiting for a confirmation charge attempt;
-
Converted: indicates the number of trials that had their first charge confirmed, converting into paid subscriptions;
-
Canceled: indicates the number of canceled trials.
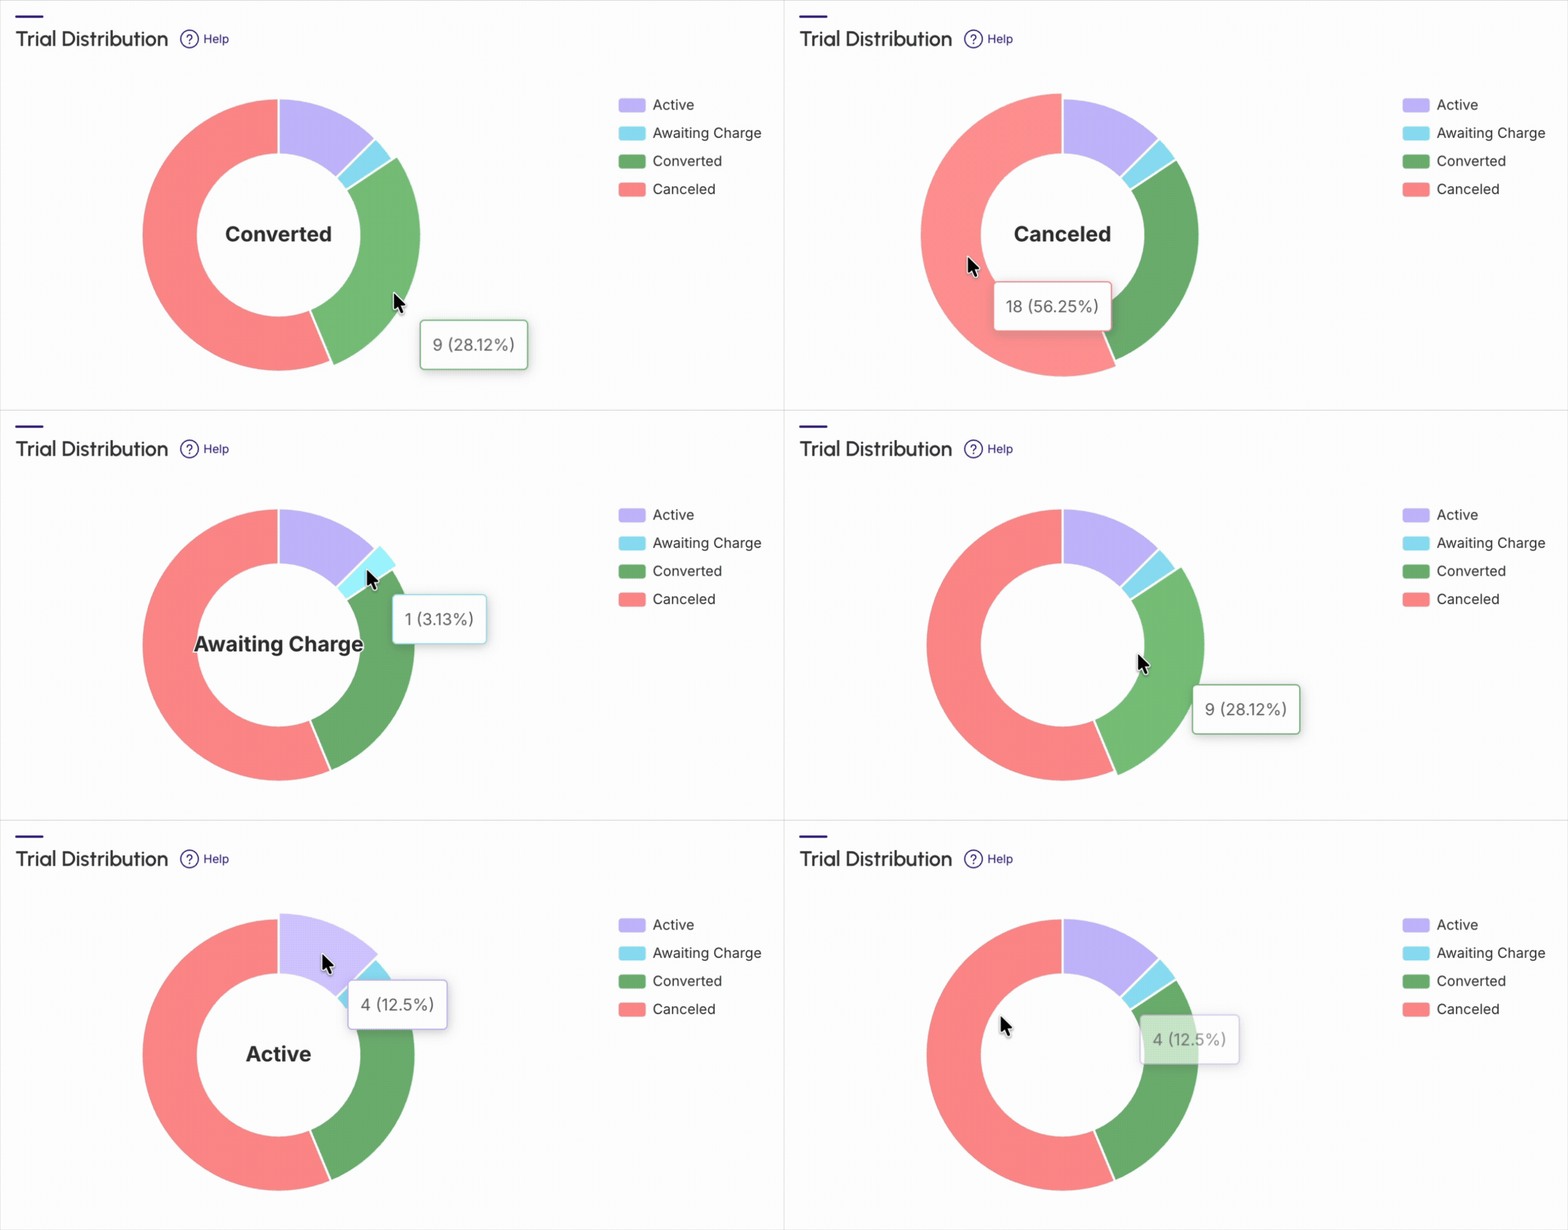
The chart displayed in this section allows evaluating where most subscriptions are concentrated and, consequently, where to focus conversion efforts.
-
Higher concentration in active: indicates that a relevant volume of subscribers is still in the test period - in this scenario, you can monitor trials close to ending and reinforce messaging before the conversion date using autoresponders and SMS tools to automate these reminders during the test period;
-
Higher concentration in pending charge: indicates that there are already ended trials waiting for first payment confirmation - in this case, it is important to track charges and act quickly on potential failures;
-
Higher concentration in canceled: may indicate difficulties in the trial experience, onboarding, messaging, or perceived product value - you can consider churn types to analyze whether cancellations occur due to billing failures or voluntary user action;
-
Higher concentration in converted: indicates that a relevant portion of trials reached first payment confirmation, signaling good utilization of the test period - even after converting, it is important to maintain subscriber follow-up by the Customer Success team, ensuring the initial paid subscription experience sustains the value perceived during the trial, as well as monitoring the health of these subscriptions through the Renewals and Churn dashboards.
To deepen this analysis, you can consult the most recurring churn types in your business in the Subscriptions Dashboard - Churn, and thus identify if causes point to adjustments in messaging during trial, billing processes, or perceived product value.
The displayed statistics refer to the selected period - by default, results consider subscriptions from the last 28 days. To view trial distribution for a specific period, apply the desired filter.
Conversion Type
The Conversion Type section presents charge attempts related to trial conversions, allowing you to track how these conversions were made.
Conversions can be performed in two ways:
-
Automatic: indicates that the charge was processed automatically through the automated flow;
-
Manual: indicates that the charge was made via a standalone payment link sent to the subscriber.
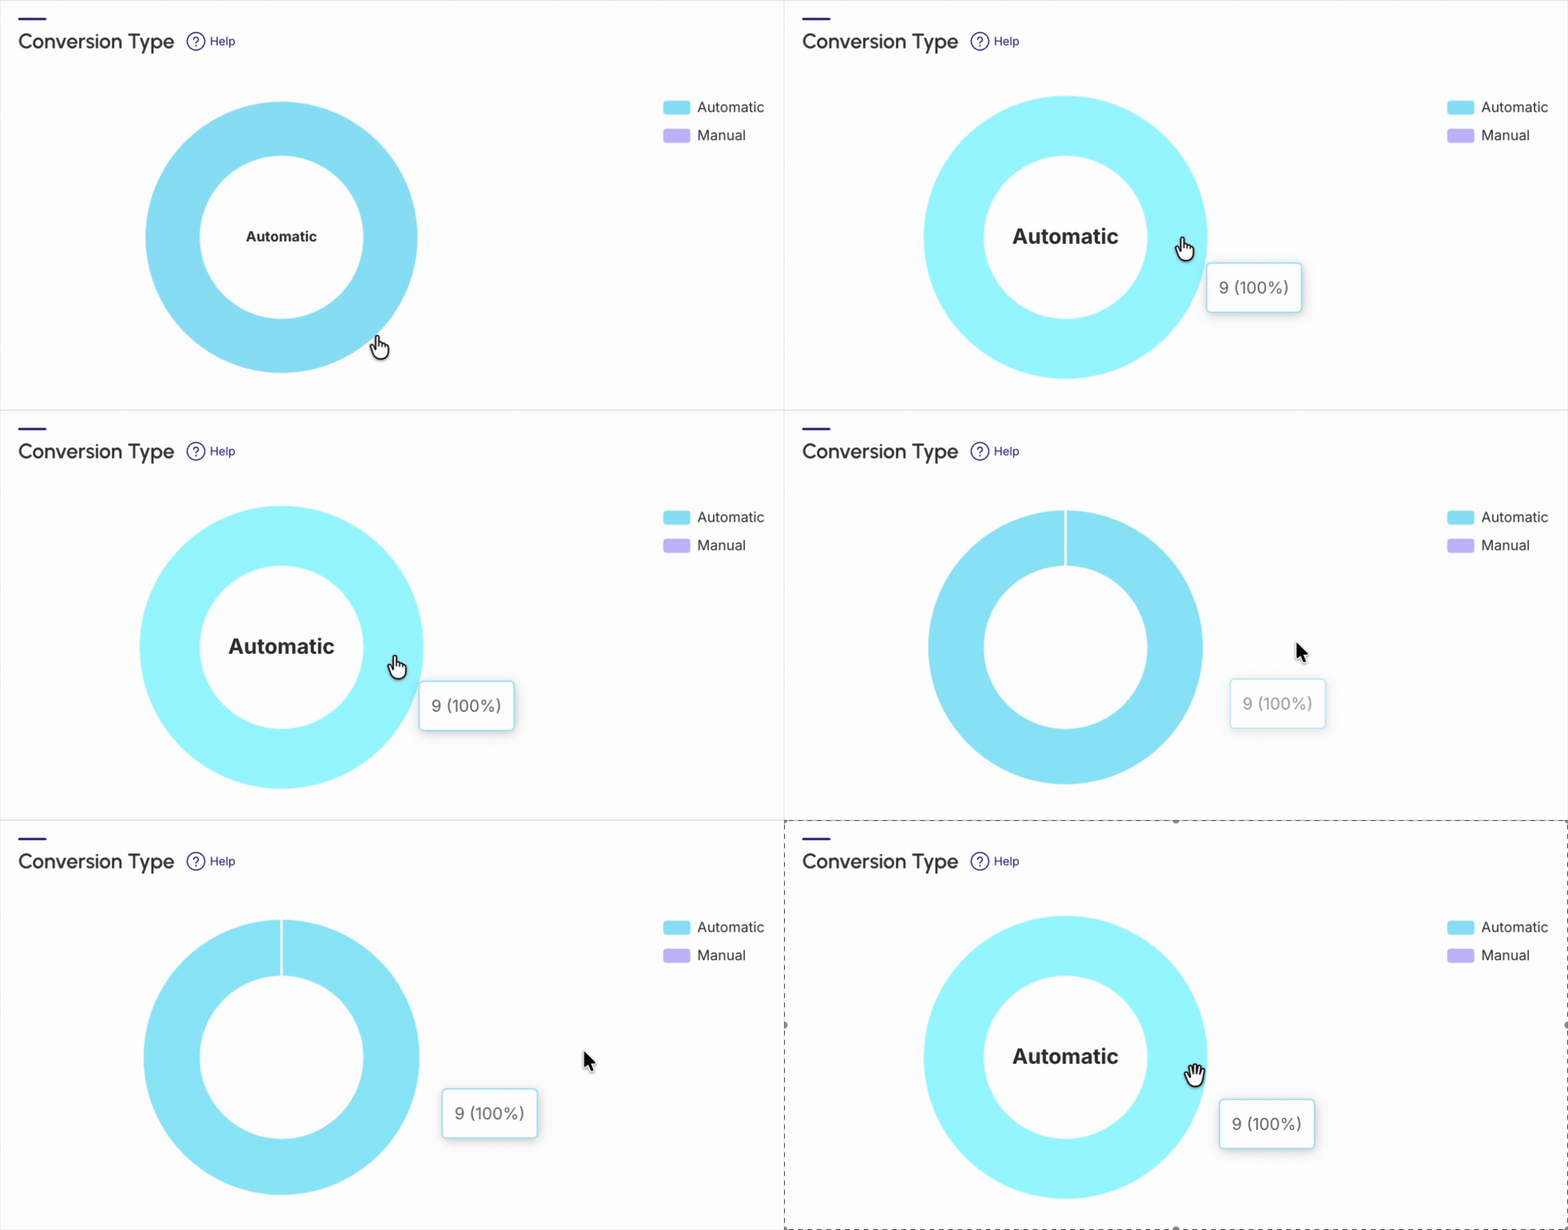
The ratio between automatic and manual conversions allows evaluating the efficiency of the billing process in the trial confirmation stage.
Based on the percentage of manual conversions, it is possible to identify opportunities to increase trial conversion into paid subscriptions, such as:
-
Reduce subscriber loss during confirmation: the more efficient automatic billing is, the lower the need for manual intervention and the lower the risk of the subscriber dropping out before completing payment - which already contributes to a healthier LTV (Lifetime Value) from the beginning of the subscription;
-
Recover trials that did not convert automatically: by identifying subscribers whose automatic billing failed, you can proactively send a standalone payment link, giving a second chance for conversion before the trial is lost - thus preventing this customer from turning into churn right on the first charge.
To perform a manual conversion, a standalone payment link for the trial confirmation charge is sent to the subscriber - the same mechanism used in recurring subscription renewals.
In the Renewals Dashboard, you can view the percentage of renewal charges paid outside the automatic flow.
By default, the presented results consider subscriptions from the last 28 days.
Trials to end
The Trials to end section allows tracking trials close to ending, making it easier to identify subscriptions that are near their test period completion date.
-
Contact: displays the contact name associated with the trial;
-
Product: displays the product associated with the subscription;
-
Start Date: displays the trial period start date;
-
End Date: displays the expected end date for the trial period;
-
Days Remaining: displays the number of days remaining until the trial ends.

Tracking trials close to their end date allows identifying customers who are near their first charge and creating relationship actions at the right time. To automate this communication, you can configure transactional trial end notification emails, increasing conversion chances for trials about to end.
To complement your analysis, access the Subscriptions Dashboard - Projections and view future renewals for your customer base.
To convert subscriptions
- Anticipate contact: you can reach out to the subscriber a few days before the end of the test period, reinforcing the benefits of the product or service - for this, you can use the period filter to track trials expiring in the coming days and prioritize contact with these subscribers;
- Make payment easy: send the standalone charge link in advance to reduce the risk of automatic charge failure - to obtain and copy the Payment URL, go to the Subscriptions section of the admin and then to the Invoices tab;
- Offer support: identify whether the subscriber used the product during the trial and, if they haven't, offer help with initial usage or remain available for any questions;
- Use urgency triggers: clearly communicate the trial period end date and what happens after that deadline - through integrations with autoresponders and SMS, trigger automatic reminders as the date approaches.
Guru Tip:
You can export the spreadsheet by clicking on CSV.
By default, the presented results consider subscriptions from the last 28 days.