
The External Subscriptions Dashboard offers a complete view of the subscription lifecycle and presents data from customers who have external subscriptions, meaning they use other payment processors that send subscriptions to Guru.
Through the daily volume of subscriptions, it's possible to get a daily overview of new, renewed, overdue, and canceled subscriptions, allowing you to identify your business's performance in real-time. Additionally, the dashboard provides valuable information about the best-selling plans, including quantity, recurrence, and the average ticket and profit for each.
Subscription data by number of recurrences complements this view, helping to understand the retention rate over time.
By default, the results presented consider subscriptions from the last 28 days.
On this page:
-
Overview
-
Daily Subscription Volume
-
Best-Selling Plans
-
Subscriptions by Number of Recurrences
Overview
In the Overview section, you can observe the main indicators, based on the last 28 days (4 weeks).
-
Active Subscriptions: displays subscriptions that had the most recent payment confirmed;
-
Renewed Subscriptions: displays subscriptions that were renewed from billing confirmation;
-
New Subscriptions: displays subscriptions created through sales from billing confirmation;
-
Post Due Subscriptions: displays subscriptions for which the last payment was not made;
-
Canceled Subscriptions: displays subscriptions when no new charge will be made.

Daily Subscription Volume
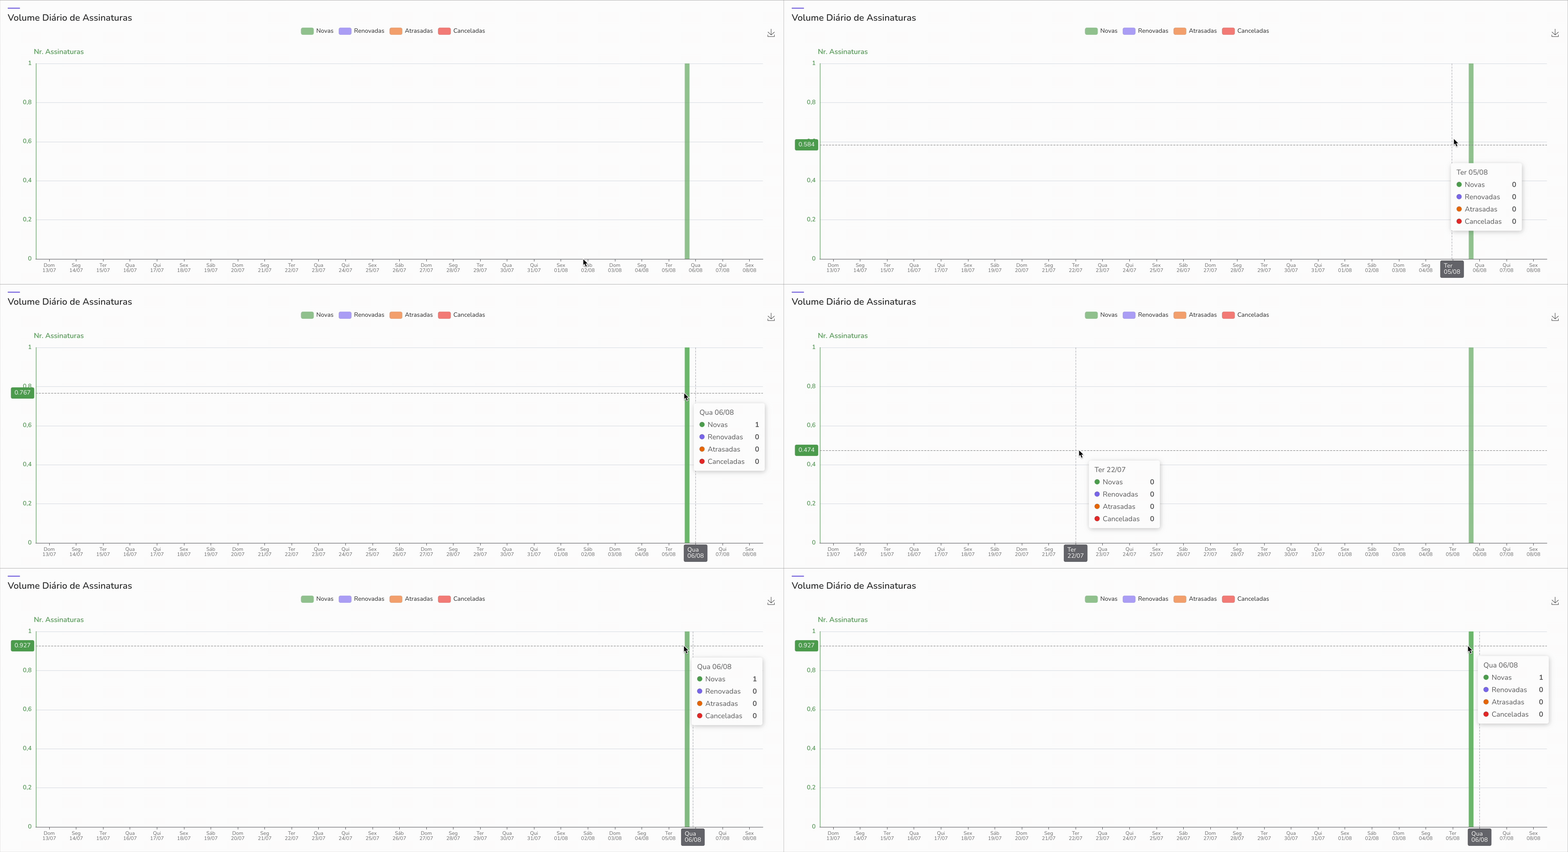
In the Daily Subscription Volume section, the metric representing the total number of subscriptions that occurred on a specific day is presented.
This metric provides a clear and detailed view of customer movement, represented in four main categories:
-
New subscriptions: displays subscriptions created through a sale, from billing confirmation;
-
Renewed subscriptions: displays the number of renewed subscriptions, from billing confirmation;
-
Overdue subscriptions: displays the number of subscriptions for which the last payment was not made;
-
Canceled subscriptions: displays the total number of subscriptions for which no new charge will be made.
What to do with Daily Subscription Volume data
-
Based on new subscriptions identify the marketing actions that generated subscription peaks - you can connect ad tools to identify conversion data and which marketing campaigns generated the new subscriptions and, thus, optimize your investment in the most profitable channels;
-
Based on renewed subscriptions create loyalty programs for renewing customers, encouraging them to continue - you can activate integration with an autoresponder to send thank-you emails, offer a loyalty benefit, or notify the team for strategic contact, strengthening the relationship;
-
Based on overdue subscriptions, you can configure automated dunning sequences to reduce delinquency - use integrations such as email marketing platforms or sms communication systems, to send personalized and scheduled reminders to recover payment;
-
Based on canceled subscriptions, you can collect feedback to understand the reasons for cancellations and use the information to create retention strategies.
By default, the results presented consider sales from the last 28 days. If the filter is changed, only subscriptions that meet the filtering criteria are considered.
Guru's Tip:
If you wish, you can save the chart image: 
Best-Selling Plans
In this section, you can observe the product table with the best-selling subscriptions, representing the top 10 subscribed products, based on indicators of quantity sold for a given subscription, maximum, average, and minimum Recurrence, Average Ticket, and Average Profit.
For each subscription, the following values are displayed:
-
Product: displays the product name;
-
Quantity: displays the quantity sold for a given subscription in the period;
-
Maximum recurrences: displays the maximum number of cycles that this product obtained from subscription recurrence in the period;
-
Average recurrences: displays the average number of cycles that this product obtained from subscription recurrence in the period;
-
Minimum recurrences: displays the minimum number of cycles that this product obtained from subscription recurrence in the period;
-
Average ticket(1): displays the average value received per sale/renewal of subscriptions (total divided by the number of subscriptions sold) in the period;
-
Average profit(2): displays the average profit to be received from subscriptions made in the period, indicating discounted expenses (such as commissions, for example).

(1) The average ticket is the result of dividing total sales by the number of transactions within the selected period.
(2) To calculate the average profit, you need to divide the net total by the number of sales.
Guru's Tip:
You can export the spreadsheet by clicking on the CSV.
Subscriptions by Recurrence Quantity
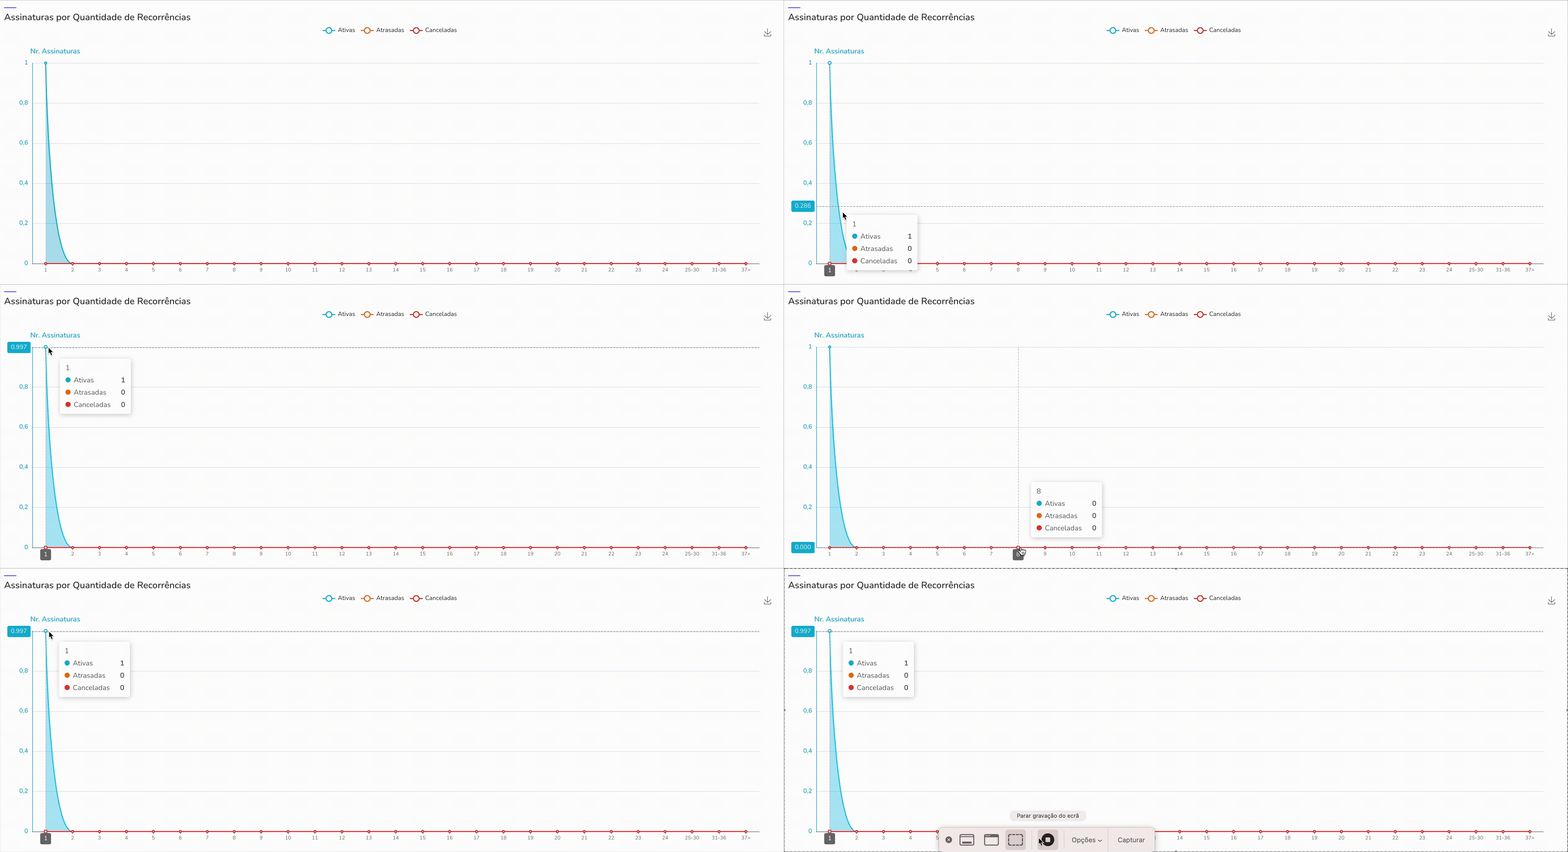
The section Subscriptions by Recurrence Quantity, indicates the total number of subscriptions, in a given billing cycle and by a subscriber's status in the database, grouped by active, overdue, and canceled subscriptions.
Each status — Active, Overdue, and Canceled — indicates a different moment in this journey, being:
-
Active Subscriptions: indicate subscriptions with up-to-date payment - for example, the peak in the first recurrence shows the number of subscriptions that had the first billing cycle successful;
-
Overdue Subscriptions: represent subscriptions that failed to make the last payment and, therefore, are in overdue status;
-
Canceled Subscriptions: indicate subscriptions that have been canceled and, consequently, will not have new charges made.
Guru's Tip:
If you wish, you can save the chart image: