
The Subscriptions Dashboard - Projections is an essential tool for strategic management, allowing you to visualize the future and anticipate business performance, focusing on proactive management and growth, and its forecasts are based on the next cycle's date (when the invoice is scheduled to be due).
When accessing the dashboard, you view, by default, the results of the last 28 days (4 exact weeks).
On this page:
-
Expected Renewals by Attempt
-
Forecast Summary
-
Expected Renewals (Next 28 Days)
-
Expected Renewals (Next 12 Months)
Expected Renewals by Attempt
In the section Expected Renewals by Attempt, you view the number of subscriptions and the total predicted for each renewal attempt. The data is presented clearly, allowing you to monitor the performance of your renewals and easily identify which attempts are most successful.
Chart
The chart displays the variation of predicted renewals by attempt in terms of subscription quantity, and the predicted value per renewal attempt in the period, which can be daily (for periods up to 28 days).
Performance indicators
-
1st Attempt: shows that renewals occurred on the first attempt - indicates that most subscriptions are renewed in the first billing cycle;
-
2nd, 3rd, and 4th Attempts: shows that renewals occurred from the second attempt onwards - the low number of renewals in subsequent attempts suggests that most billing problems are resolved in the first attempt;
-
Total Predicted: displays the total predicted, i.e., the sum of all expected renewals in the period.
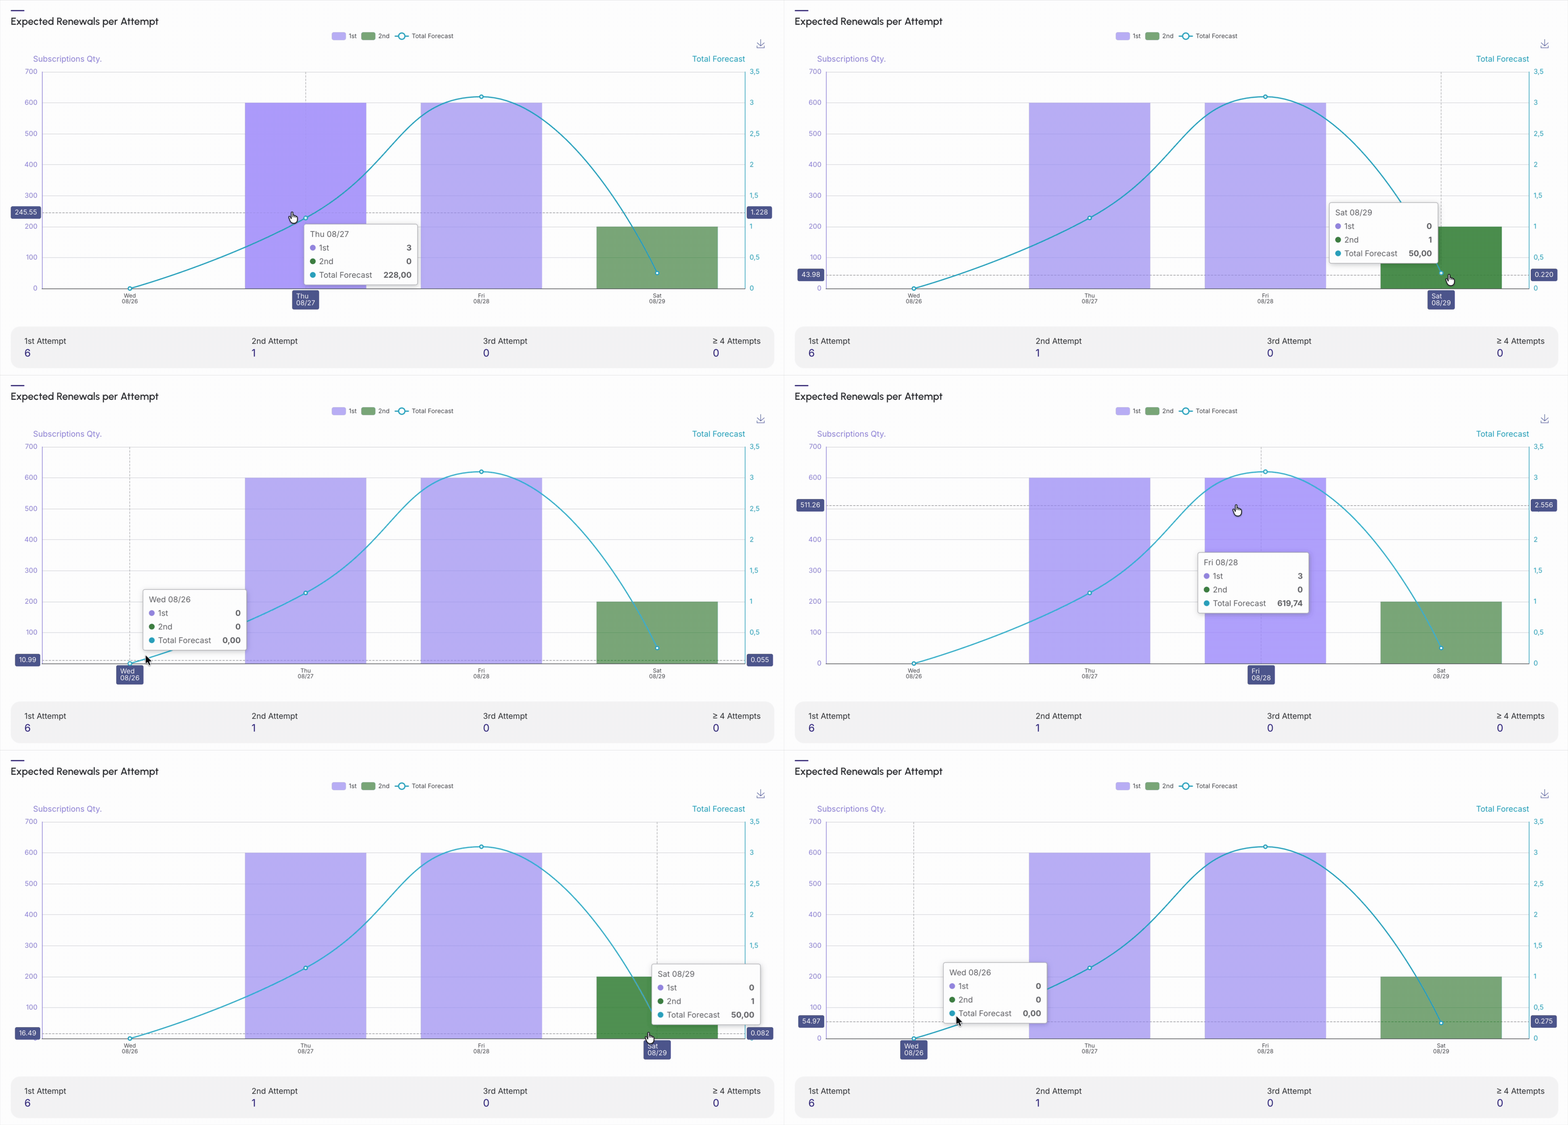
From the chart data, we can observe that:
-
Based on the distribution of renewals, it is possible to analyze that predicted renewals are concentrated in the 1st Attempt, indicating that most subscriptions are renewed in the first billing cycle.
-
It is noted that subsequent attempts (2nd, 3rd, and 4th) show a much smaller volume of renewals, which indicates that most billing problems are resolved in the 1st Attempt - by monitoring this data, you can quickly identify an increase in billing failures in the first attempts and act promptly, checking customer payment information or your notification system.
Guru Tip:
If desired, you can save the chart image: 
Forecast Summary
In the section Forecast Summary, you get a general and direct overview of what to expect with your subscription renewals over a specific period (28 days).
-
Attempt: displays which attempt the renewal charge for subscriptions is predicted in the period;
-
Number of Subscriptions: displays the total number of active subscriptions considered in the period;
-
Predicted Net Value: displays the predicted net value to be received from existing subscriptions in the period;
-
Average Ticket: displays the average value per subscription, dividing the Total Predicted by the number of Subscriptions in the period.

Benefits for decision-making with the Forecast Summary
-
Financial Planning: you can better plan your cash flow by knowing the predicted net value - this information allows you to anticipate future revenue and make decisions about investments, hiring, or expenses;
-
Performance Overview: the number of subscriptions and the average ticket together offer a clear view of your customer base - for example, if the number of subscriptions is growing and the average ticket remains stable, it's a great sign; conversely, if the average ticket rises but the number of subscriptions falls, it could be a warning to analyze customer retention.
-
Problem Prevention: based on the attempt information, it is possible to observe if most of your renewals are predicted for the first attempt - if you notice that a growing number of subscriptions are not renewing on the 1st Attempt, you can proactively investigate and resolve payment problems, such as sending a link for a separate payment.
Guru Tip: You can export the spreadsheet by clicking on the CSV.
Expected Renewals (Next 28 Days)
In the section Expected Renewals (Next 28 days), you can observe the main indicators, based on the last 28 days (4 weeks).
-
Total Forecast: displays the total projected value to be received from existing subscriptions in the period;
-
Net Value: displays the total projected value to be received from subscriptions after deducting fees, costs, and/or taxes.
-
Net: displays the percentage of the total net amount you will receive from subscriptions made in the period;
-
Subscriptions Qty: displays the total number of active subscriptions considered in the period;
-
Average Ticket: displays the average value per subscription, dividing the Total Predicted by the number of Subscriptions in the period;
-
Average Net Value: displays the average value per subscription after deducting fees and costs.
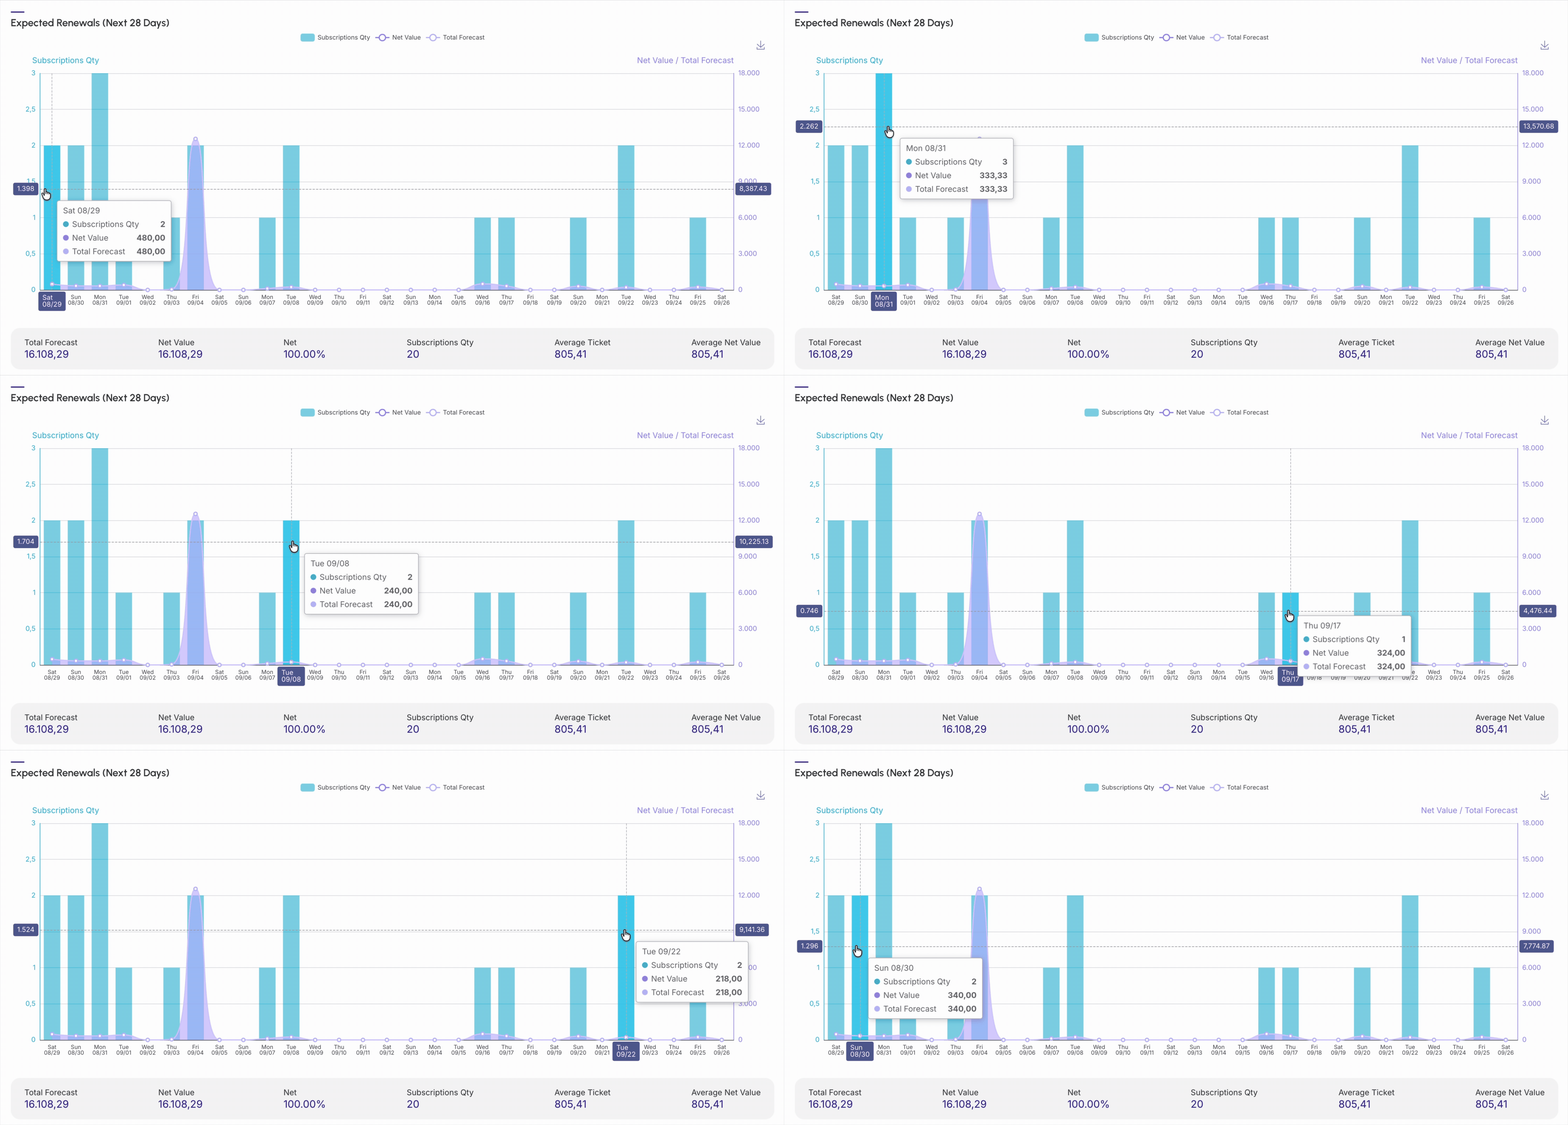
The indicator data can be used to boost your results. For example:
-
The Total Predicted offers a projection of future revenue, helping to understand your expected cash flow - this information is fundamental for financial planning, resource allocation, and goal setting;
-
By analyzing the Average Ticket it is possible to evaluate the effectiveness of your business model and pricing, allowing for important decisions to be made, such as restructuring subscription plans, creating more attractive packages, launching new products, or intensifying marketing efforts; and
-
With the Subscriptions data, it is possible to analyze the growth of the subscriber base - the number of subscriptions indicates success in attraction and retention - in addition, by cross-referencing this data with renewal and cancellation information, it is possible to better understand your churn rate and develop strategies to improve retention.
By default, the results presented consider subscriptions from the last 28 days.
Expected Renewals (Next 12 Months)
Expected renewals are the projection of subscriptions that are scheduled to be automatically renewed or that the customer continues to use the service.
It is a financial and customer success indicator that helps predict future revenue. Having a high predicted renewal rate demonstrates that you are successfully retaining your customers and that the product or service continuously adds value.
In addition to the chart, general performance metrics and results analysis are calculated, such as:
-
Total Predicted Subscriptions: displays the total value of all subscriptions made during a given period;
-
Total net: displays the total net amount of subscriptions you will receive in the period, already deducting affiliate commissions;
-
% net: displays the percentage of the total net amount you will receive from subscriptions made in the period;
-
Number of Subscriptions: displays the number of subscriptions made in the period;
-
Average ticket(1): displays the average value received per cycle/renewal (total divided by the number of subscriptions) in the period;
-
Average Net Value(2): displays the average net value to be received from subscription renewals made in the period, indicating deducted expenses (such as commissions, for example).
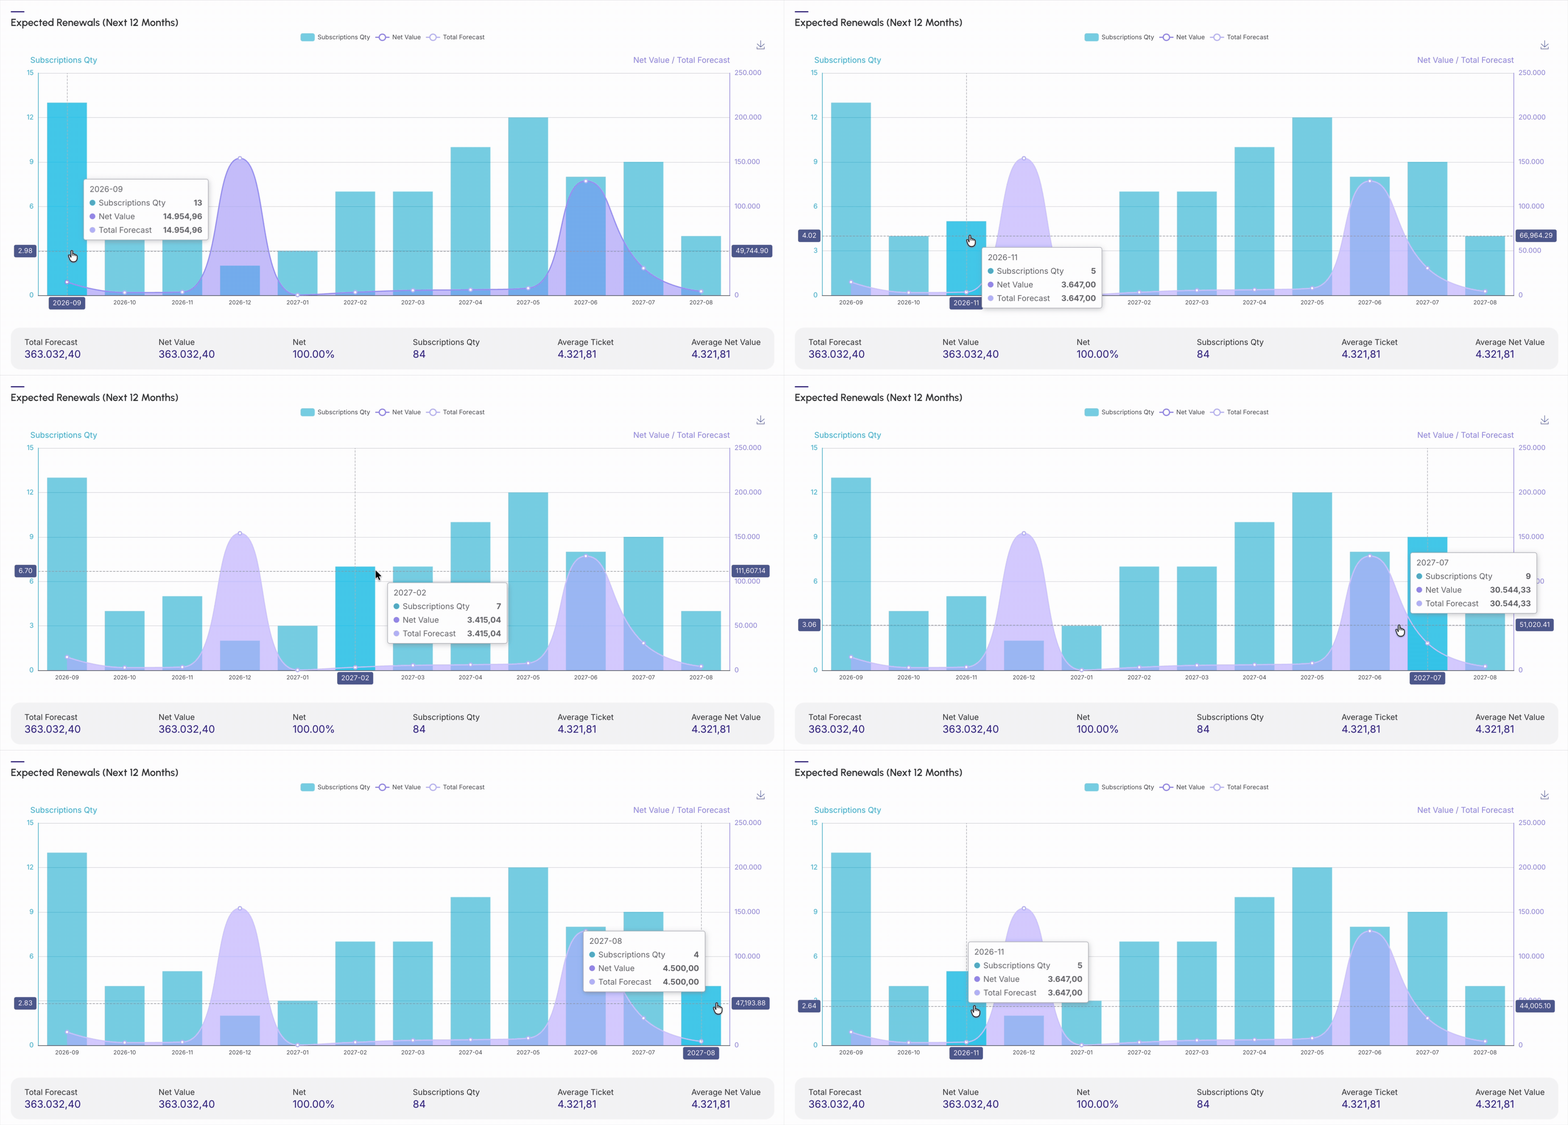
(1) The average ticket is the result of dividing total sales by the number of transactions within the selected period.
(2) To calculate the average profit, you need to divide the total net by the number of sales.
By default, the results presented consider subscriptions from the last 12 months.
Guru Tip:
If desired, you can save the chart image: