
The Subscriptions Dashboard - Summary presents the main indicators, such as the total projected revenue, the total number of subscriptions, and the average ticket.
In addition, it details the renewal rates of the subscription base and, in the best-selling products, it shows the performance of each offer, its recurrences, in addition to the average ticket and profit generated. The dashboard deepens this view by displaying subscriptions by number of recurrences, allowing to identify at which stage of the subscription lifecycle they are.
And the reasons for refusal per attempt offer insights into possible failures in subscription charge attempts.
On this page:
-
Overview
-
Subscription Volume
-
Renewal Rate
-
Top Plans
-
Subscriptions by Number of Recurrences
-
Reasons for Refusal per attempt
Overview
In the Subscriptions Overview section, you can observe the main indicators, based on the last 28 days (4 weeks). You can apply the filter to view a smaller subset of existing subscriptions, linked to the selected products.
-
Active Subscriptions: displays subscriptions that had the most recent charge payment confirmed;
-
Renewed Subscriptions: displays subscriptions that were renewed from charge confirmation;
-
New Subscriptions: displays subscriptions created through sales from charge confirmation;
-
Displays subscriptions that did not have the last payment made;: overdue Subscriptions
-
Canceled Subscriptions: displays subscriptions when no new charge will be made.

By default, the results presented consider subscriptions from the last 28 days.
Subscription Volume
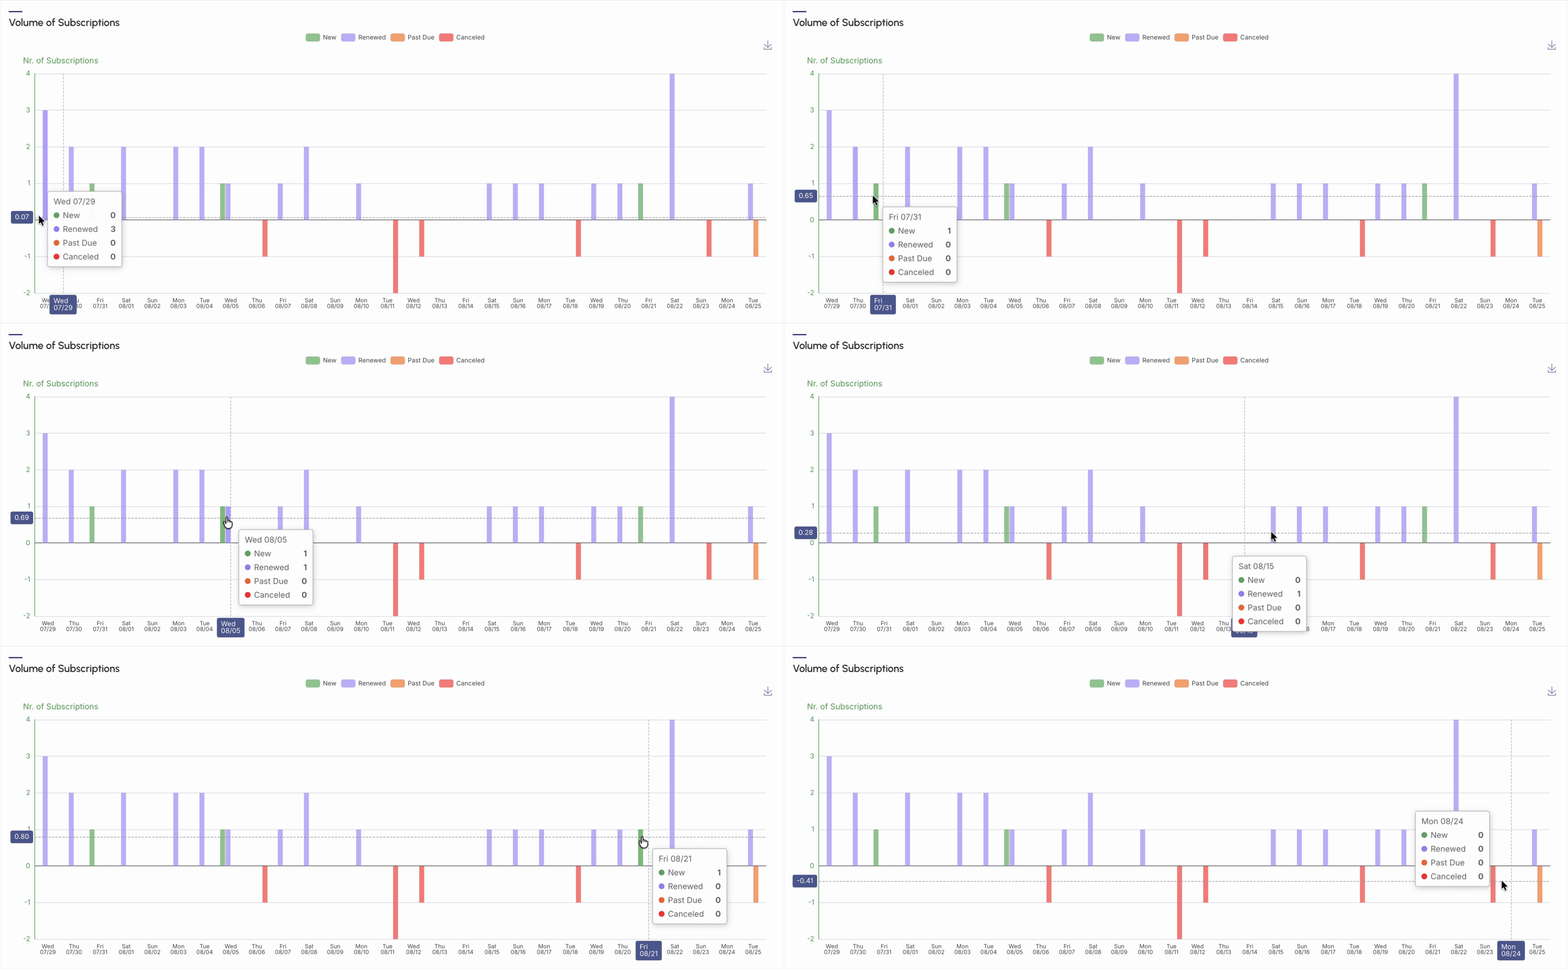
In the Daily Subscription Volume section, the graph represents an overview of the Subscription Volume, relating the number of new, renewed, overdue, and canceled subscriptions.
-
New Subscriptions: displays subscriptions created through sales from charge confirmation;
-
Renewed Subscriptions: displays subscriptions that were renewed from charge confirmation;
-
Overdue Subscriptions: displays subscriptions that did not have the last payment made;
-
Canceled Subscriptions: displays subscriptions when no new charge will be made.
Actions that can be taken based on performance indicators
-
Based on the monitoring of new subscriptions, you have access to the indicators of your marketing and sales strategies - a constant increase in the number of new subscriptions is a clearer sign that your business is growing;
-
Based on renewed and canceled subscription information, it is possible to monitor the quantity of renewals and cancellations - for example, a high renewal rate demonstrates that customers find continuous value in your product or service, while an increase in cancellations is a red flag that requires immediate investigation; and
-
Based on overdue subscriptions , it is possible to identify potential revenue losses - tracking this metric allows for proactive recovery before they become cancellations - the customer success team can analyze this data to identify what might be happening.
Renewed Rate
In the Renewed Rate section, the graph represents an overview of the Subscription Volume, and is displayed in days (up to 31 days) or months (over 31 days), relating the number of new, renewed, overdue, and canceled subscriptions.
-
Rate of possible renewals: displays the total number of possible subscriptions;
-
Rate of Renewed Subscriptions: displays the percentage of subscriptions that were renewed, based on payment confirmation;
-
Rate of Overdue Subscriptions: displays the percentage of subscriptions that did not have the last payment made;
-
Rate of Cancelled Subscriptions: displays the percentage when a new charge will occur.
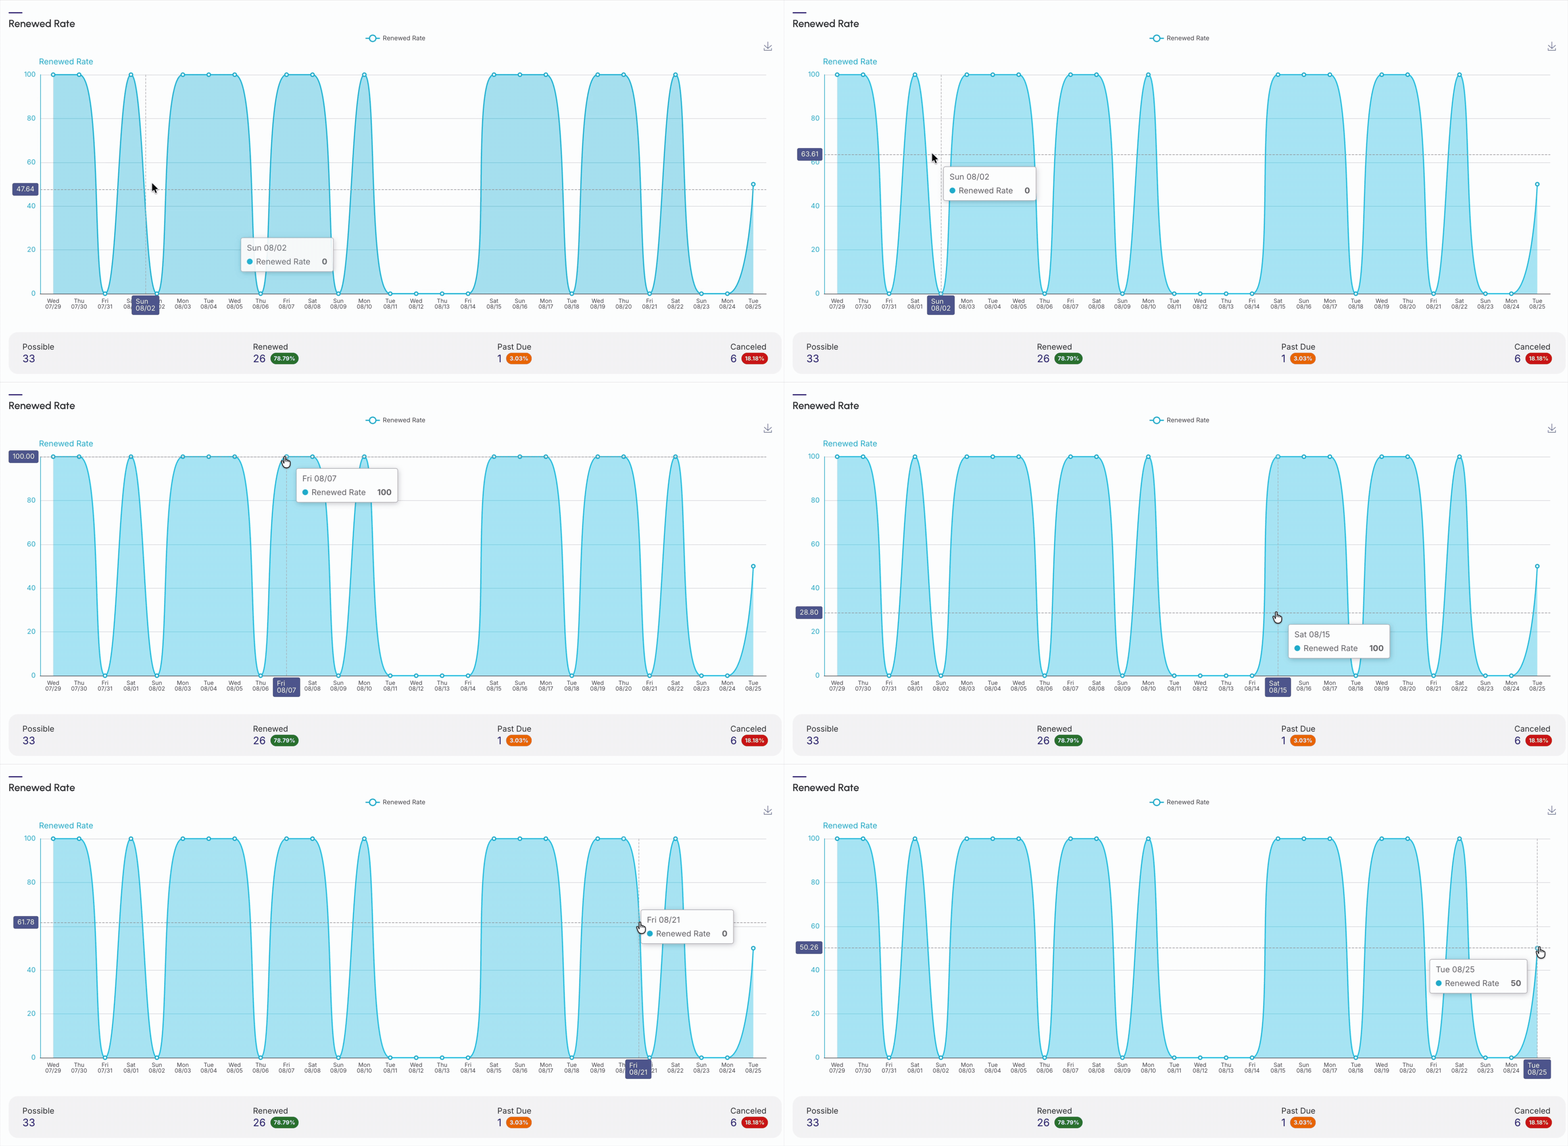
By default, the results presented consider subscriptions from the last 28 days.
Guru Tip:
Use the chart controls for better analysis and use the colors to identify subscriptions.
Best-Selling Plans
In this section, you can observe the table of products with the best-selling subscriptions, representing the top 10 subscribed products, based on indicators of quantity sold for a given subscription, maximum, average, and minimum Recurrence, Average Ticket, and Average Profit.
For each subscription, the following values are displayed:
-
Product: displays the product name;
-
Quantity: displays the quantity sold of a given subscription in the period;
-
Maximum Recurring: displays the maximum number of cycles that this product obtained from subscription recurrence in the period;
-
Medium Recurring: displays the average number of cycles that this product obtained from subscription recurrence in the period;
-
Minimum Recurring: displays the minimum number of cycles that this product obtained from subscription recurrence in the period;
-
Average Ticket(1): displays the average value received per sale/renewal of subscriptions (total divided by the number of subscriptions sold) in the period;
-
Average Profit(2): displays the average profit to be received from subscriptions made in the period, indicating discounted expenses (such as commissions, for example).

(1) The average ticket is the result of dividing total sales by the number of transactions within the selected period.
(2) To calculate the average profit, it is necessary to divide the net total by the number of sales.
Guru Tip:
You can export the spreadsheet by clicking on CSV.
Subscriptions by Number of Recurrences
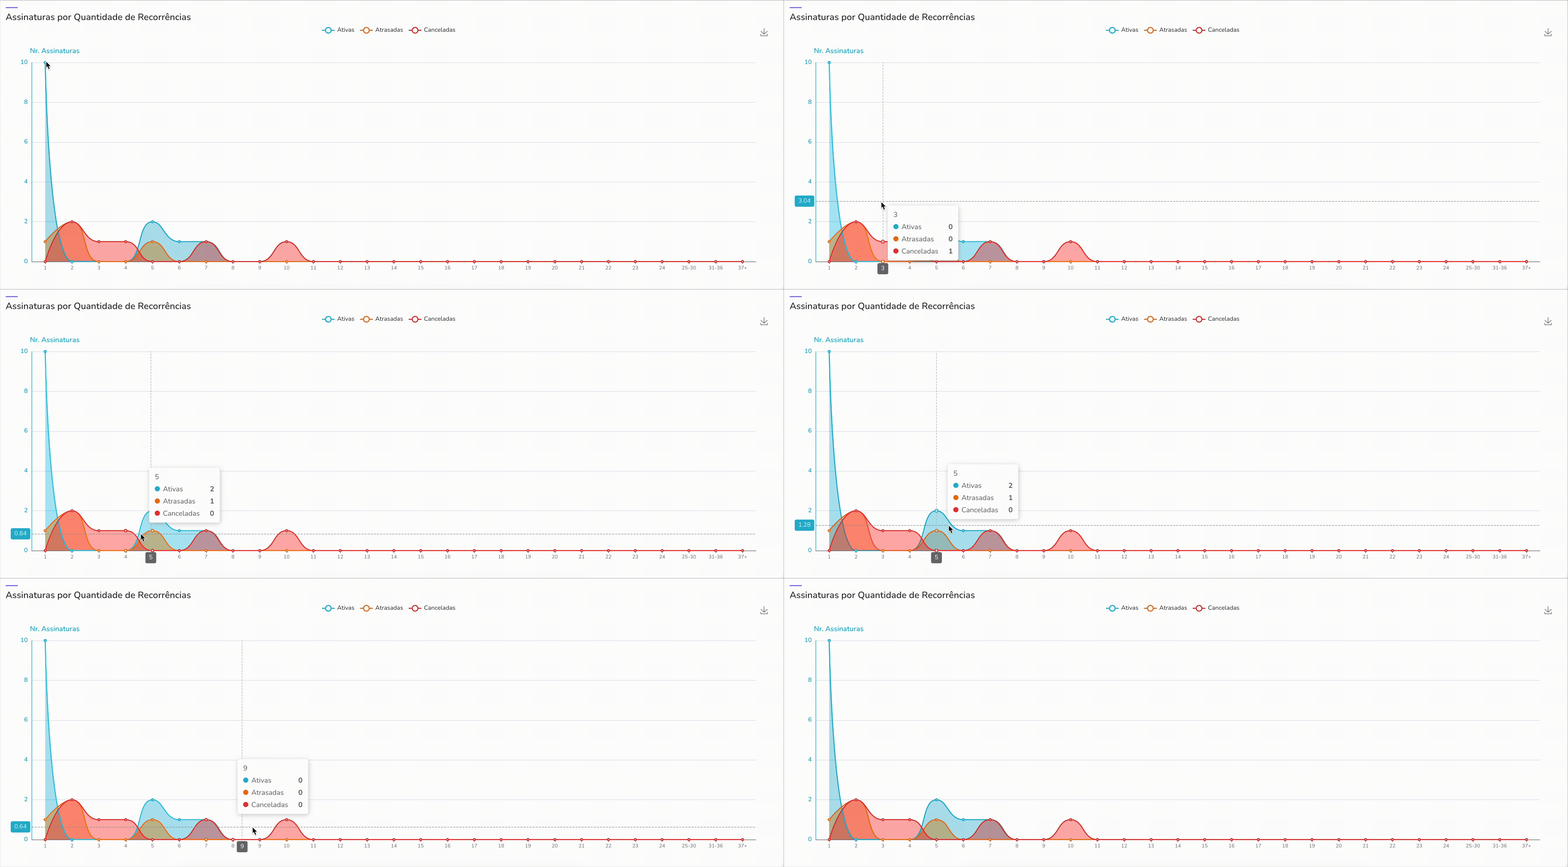
The Subscriptions by Number of Recurrences section indicates the total number of subscriptions, in a given billing cycle and by a subscriber's status in the base, grouped by subscriptions. Thus, the focus is to analyze behavior over time, i.e., at what stage of the payment journey the subscription is.
-
Active Subscriptions: indicate how many subscriptions are active in a given billing cycle - as in the example below, the high concentration of active subscriptions in recurrence 1 shows that most subscribers are in their first month. The gradual drop in the blue line shows the natural retention rate of the customer base over time;
-
Overdue Subscriptions: indicate the number of subscriptions that have not been paid in a given billing cycle - as in the example below, the concentration of overdue payments in the first recurrences may indicate that customers are facing technical payment problems or that communication for payment reminders is not effective in the initial stages of the subscription.
-
Canceled Subscriptions: indicate the number of cancellations in a given billing cycle - as in the example below, most cancellations occur in the first recurrences. From this data, it is possible to focus on retention from the beginning of the journey to identify the possible causes of cancellations.
Guru Tip:
If desired, you can save the chart image: 
Reasons for Refusal per attempt
The Reasons for Refusal per attempt section presents the reasons why charges fail (e.g., expired card).
This allows the finance or support team to act precisely to recover payments and prevent churn.