
In the Sales P.P.C.T. Dashboards, metrics, indicators, graphs, and performance analysis of sales results will be presented, providing a detailed view of sales performance, from traffic investment to final conversion.
In Guru's sales tracking dashboard, you will find information such as:
-
Funnel: clear and quick view of the performance of your P.P.C.T. campaigns, clicks, checkouts, total sales, revenue, cost per click (CPC), total cost of each click on the campaign link (CPA), cost per sale (CPV); average ticket, average amount spent to generate each sale;
-
Statistics: data on traffic generated by campaigns, including investments, clicks, ROI (Return on Investment);
-
Sources: the traffic sources that generated the sales;
-
Trackings: allows observing the origins of traffic sources, generated clicks, and sales and invested return.
The sales tracking dashboard is a tool that assists in analyzing the performance of each campaign, offering precise information for decision-making, in order to boost your results.
When accessing the dashboard, you view, by default, the results of the last 28 days (4 exact weeks). If desired, you can analyze other periods by applying a filter.
On this page:
-
Capture Funnel
-
Statistics
-
Sources
-
Best-selling Products
-
Trackings
Capture Funnel
In the Capture Funnel section, under Clicks, Checkouts, Sales and VALID, you will see the number of clicks tracked in the period; the number of clicks that went through checkout in the period; the total sales made in the period; and the total valid sales made in the period. In addition, you can observe the main indicators, such as:
-
Revenue: displays the total sum of sales made in the period;
-
Cost: displays the total campaign cost in the period;
-
ROI: displays the ROI invested from valid sales in the period;
-
Average Ticket1: displays the average value of each sale in the period (total divided by the number of sales);
-
CPV: displays the cost per sale;
-
CPC2: displays the costs per lead clicks in the period;
-
Ideal CPV (100% ROI)3: displays the cost of ROI per ideal sale;
-
Ideal CPC: displays the ideal cost per sale.
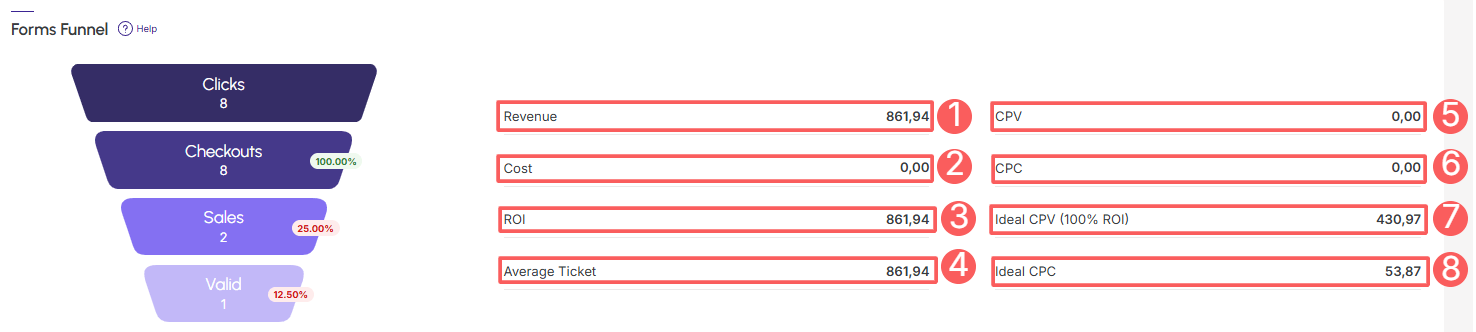
(1) The average ticket is the result of dividing total sales by the number of transactions within the selected period.
(2) CPC is calculated by dividing the total campaign cost by the number of clicks it generated.
(3) The Ideal CPV would be (ROI (invested value) x CPC (cost per lead)).
By default, the presented results consider customers from the last 28 days. If the filter is changed, only customers who meet the filtering criteria are considered.
Statistics
In the Statistics section, you can observe the main indicators, such as:
-
Total Clicks: displays the total clicks from checkouts initiated in the period;
-
Total Sales: displays the total value of all sales made in the period;
-
Total Valid Sales: displays the total valid sales from checkouts initiated in the period;
-
Conversion Rate: displays the conversion rate of clicks from checkouts initiated in the period.
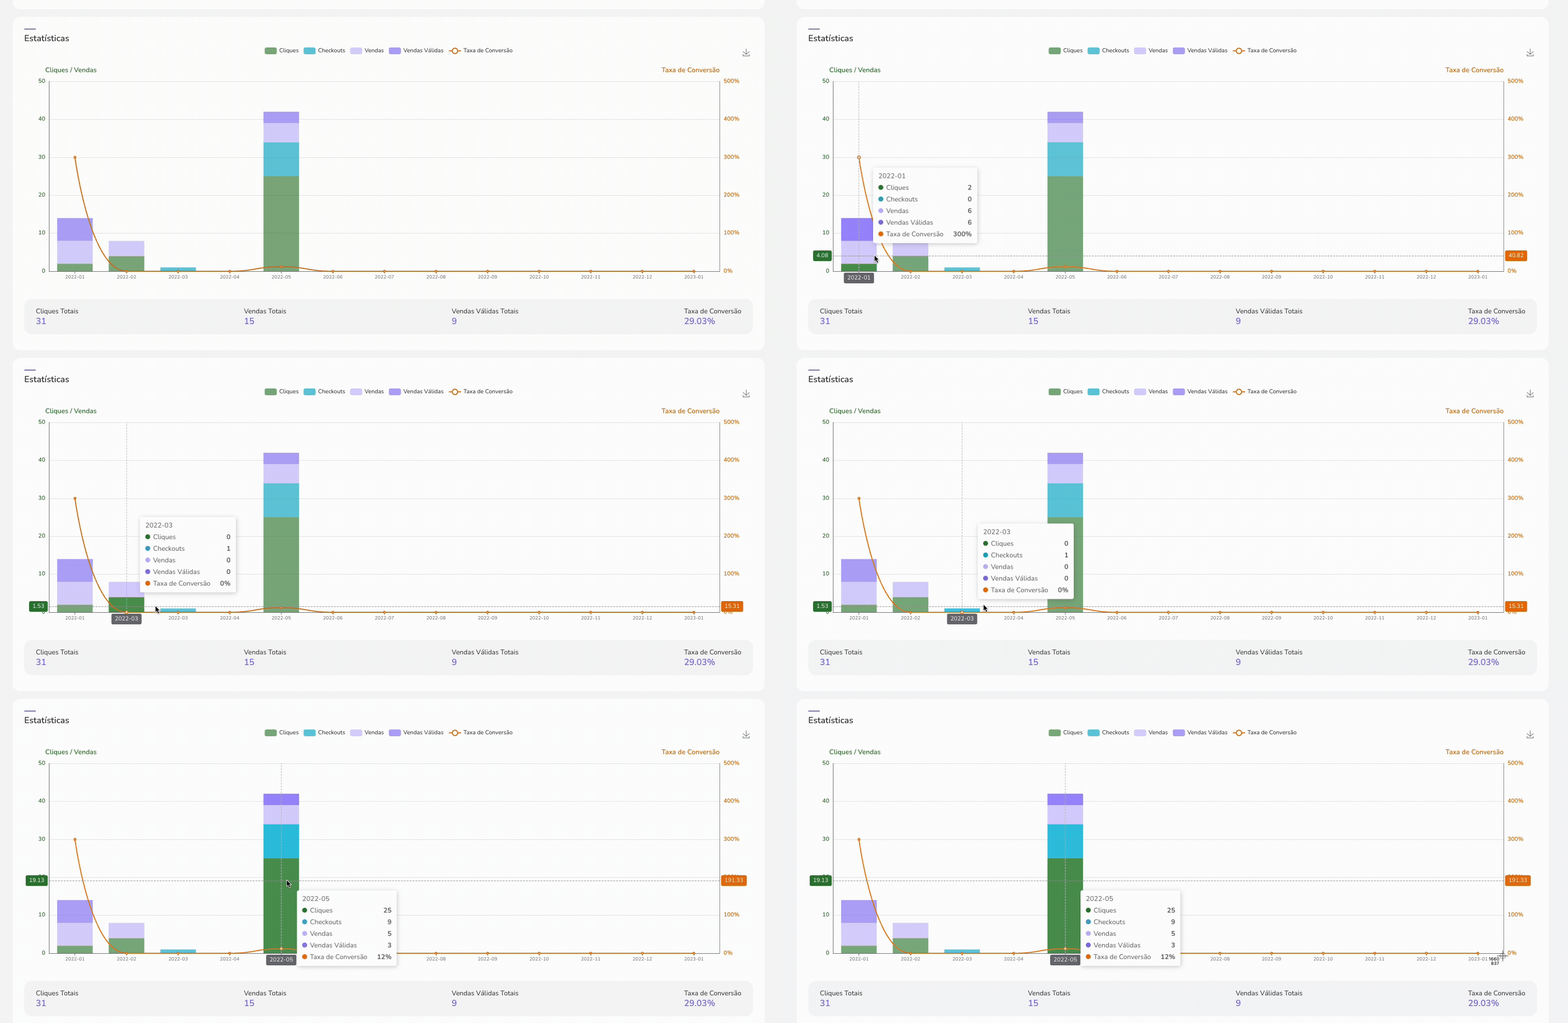
By default, the presented results consider customers from the last 28 days. If the filter is changed, only customers who meet the filtering criteria are considered.
Guru's Tip:
If desired, you can save the chart image: 
Sources
In the Sources section, it is possible to consult the origin of captured sales, grouped by traffic source, informed in the tracking link, when the P.P.C.T.were created.
For each lead, the following values are displayed:
-
Source: displays the name of the tracking source in the period;
-
Clicks: displays the number of tracked clicks in the period;
-
Checkouts: displays the number of clicks that went through checkout in the period;
-
Sales: displays the total sales made in the period;
-
Valid: displays the valid sales completed in the period;
-
Revenue: displays the total sum of sales made in the period;
-
Cost: displays the total campaign cost in the period;
-
CPA: displays the total cost of each click on the tracked campaign link;
-
ROI: displays the ROI invested from valid sales in the period.

By default, the presented results consider customers from the last 28 days. If the filter is changed, only customers who meet the filtering criteria are considered.
Guru's Tip:
You can export the spreadsheet by clicking on CSV.
Best-selling Plans
In the Best-selling Plans section, it is possible to observe the ranking of best-selling products, where the top 10 products are represented.
For each product, the following values are displayed:
-
Name: displays the product name;
-
Sales: displays the quantity of sales;
-
Products: displays the quantity of products sold(1);
-
Sales Total: displays the total sales value (gross revenue);
-
Affiliates Total: displays the total commission paid to affiliates;
-
Total Net Value: displays the total net amount to be received (after deducting all expenses/comissions);
-
Net Value: displays the percentage of the net total to be received.

(1) Quantity of Products sold refers to the number of items to be delivered to the customer in the sale. Example: it is possible to make 3 sales of a kit of 4 products, which will be a total of 12 products.
By default, the presented results consider sales from the last 28 days. If the filter is changed, only sales that meet the filtering criteria are considered.
Guru's Tip:
You can export the spreadsheet by clicking on CSV.
Trackings
In the Trackings section, it is possible to observe the origin of the trackings of captured leads, grouped by traffic source, informed in the tracking link, when the P.P.C.T.were created.
For each lead, the following values are displayed:
-
Name: displays the name of the products sold(1) in the period;
-
Source: displays the name of the tracking source in the period;
-
Clicks: displays the number of tracked clicks in the period;
-
Checkouts: displays the number of clicks that went through checkout in the period;
-
Sales: displays the total sales made in the period;
-
Valid: displays the valid sales completed in the period;
-
Revenue: displays the total sum of sales made in the period;
-
Cost: displays the total campaign cost in the period;
-
CPA: displays the total cost of each click on the tracked campaign link;
-
ROI: displays the ROI invested from valid sales in the period.

By default, the presented results consider customers from the last 28 days. If the filter is changed, only customers who meet the filtering criteria are considered.
Guru's Tip:
You can export the spreadsheet by clicking on CSV.