
Find answers to frequently asked questions and situations related to Sales Dashboards in Guru. This data facilitates a consolidated view of your sales performance and helps analyze volume, behavior, sources, products, payment methods, and affiliate share.
On this page:
-
Managing sales information
-
Sales Indicators
-
Sales Evolution
-
Sales Behavior by Period
-
Performance of Payment Methods
-
Payment Processors Analysis
-
Customer self-declared origin
-
Conversions by Payment Method
-
Sales Distribution by Origin
-
Plan Performance (Products)
-
Reasons for payment refusal
-
Affiliate Performance
Managing sales information
In this section, you will find guidance on how to filter and export the information displayed in the Sales Dashboard. This way, you adjust the data according to the desired period and use features that facilitate the analysis of your business.
- How can I filter the Sales Dashboard data?
You can filter Sales Dashboard information in Guru's admin. To do this, click on the side menu, go to Dashboards and then select Sales.
When applying filters, you will be able to analyze:
-
Sales date type and period: filters by Date and Period define whether the search should consider the date of approval or creation of the sale and the analysis time interval;
-
Sales identification: the Accounts and Currency filters define sales by account or by currency used in the transaction;
-
Product and producers: the Product and Producers filters enable analysis on sales linked to a specific product or product group , in addition to selecting the desired producer;
-
Payment methods: the Marketplace and Payment methods filters define transactions by marketplace or by payment method used;
-
Tracking: the filters Leads, Tracked sales, Tracking users, Restrict F.P.C.R. search by group, lead F.P.C.R., sales F.P.C.R. and CHECKOUT F.P.C.R. define sales associated with lead tracking, sales , or checkout;
-
Affiliation: the Sales with affiliation, Affiliate name and Affiliation filters allow searching for sales with or without affiliation, filtering by affiliate name or affiliation code.
By default, the Sales Dashboard shows results for the last 28 days (4 weeks). The consolidated metrics for this interval are calculated automatically. To analyze a different period, you can filter the dashboard by period, using pre-defined periods or selecting the desired date*.
This allows you to analyze everything from a specific subset of sales to larger periods to monitor trends and growth in your customer base.
*Filled dates must cover a maximum interval of 1 year.
- How can I export the Sales Dashboard data?
To export the Sales Dashboard data, access the side menu in Guru admin, click on Dashboards and, under Sales Dashboard, click on PDF at the top of the page. After a few minutes, the PDF Download button will appear for saving.
If you wish to export data from your dashboard, go to Manage Sales Dashboards.
- How often is the Sales Dashboard data updated?
The performance indicators, charts, and metrics displayed in the Sales Dashboard are generated automatically as sales are registered on the platform or change status.
Although sales panel information is always available from the moment you record the first completed sale, it is important to note that some dashboard information is only updated after Guru receives notification from the payment processor, and there is a 5-minute cache for updating.
By default, the dashboard displays results for the last 28 days, but you can apply filters to analyze other periods.
Sales Indicators
Understand the metrics detailing your transactions results by checking sales indicators such as your revenue, sales overview, items sold, and new customers.
- Which indicators are presented in this section?
The General Metrics section of the Sales Dashboard presents sales performance data for the selected period so you can monitor your financial results and get a strategic view of your business.
The indicators displayed are:
-
Revenue: total sum of valid sales (with status
aprovadaandcompleta) completed during the period; -
Sales: total quantity of valid sales (with status
aprovadaandcompleta) completed during the period; -
Products: quantity of products (items) sold - refers to the number of items to be delivered to the customer in the sale, e.g., if you made 3 sales of a 4-product kit, this corresponds to a total of 12 products;
-
New Customers: quantity of customers who had an approved sale during the period, where this is the first sale recorded on the account - when applying the filter by group or specific product, the new customer information will display new buyers for that product, which is not necessarily a new buyer overall, meaning a buyer may appear as new multiple times;
-
Refunds: total quantity, total amount, and percentage of refunded sales.

To access more information about the displayed indicators, access the General Metrics section in Sales Dashboards.
- Does the total amount include canceled or refunded sales?
No. The indicators displayed in the General Metrics section reflect valid sales revenue and do not include the value of sales that were not completed, such as sales with status cancelada, expirada and ag. pagamento (awaiting payment).
Access and learn more about sales statuses.
To analyze all generated transactions (including uncompleted ones), you can check the Sales by Status.chart.
Sales Evolution
The Sales Volume section presents, through a chart, daily revenue behavior for the selected period. This data helps identify trends, seasonal patterns, and the impact of specific campaigns on your business.
- Which indicators are presented in this section?
The performance indicators displayed in the Sales Volume section provide a consolidated view of sales performance during the selected period.
To help you understand sales behavior and support strategic analysis based on key metrics, this data displays:
-
Total sales: total value of all sales made during the period;
-
Net total: net total to receive, i.e., deducting affiliate commissions and marketplace fees - considered in the calculation if the marketplace sends this information to Guru; if sent, these fees are also displayed in sale details;
-
Net percentage: percentage of the net total of sales made during the period;
-
Products sold: number of products sold during the period - quantity of products sold refers to the number of items to be delivered to the customer in the sale; for example, it is possible to make 3 sales of a 4-product kit, totaling 12 products;
-
Average ticket: average value per sale in the period (total divided by number of sales) - average ticket is the result of dividing total sales by the number of transactions within the selected period;
-
Average profit: average profit of sales made in the period, dividing net total by number of sales - to calculate average profit, divide net total by number of sales.
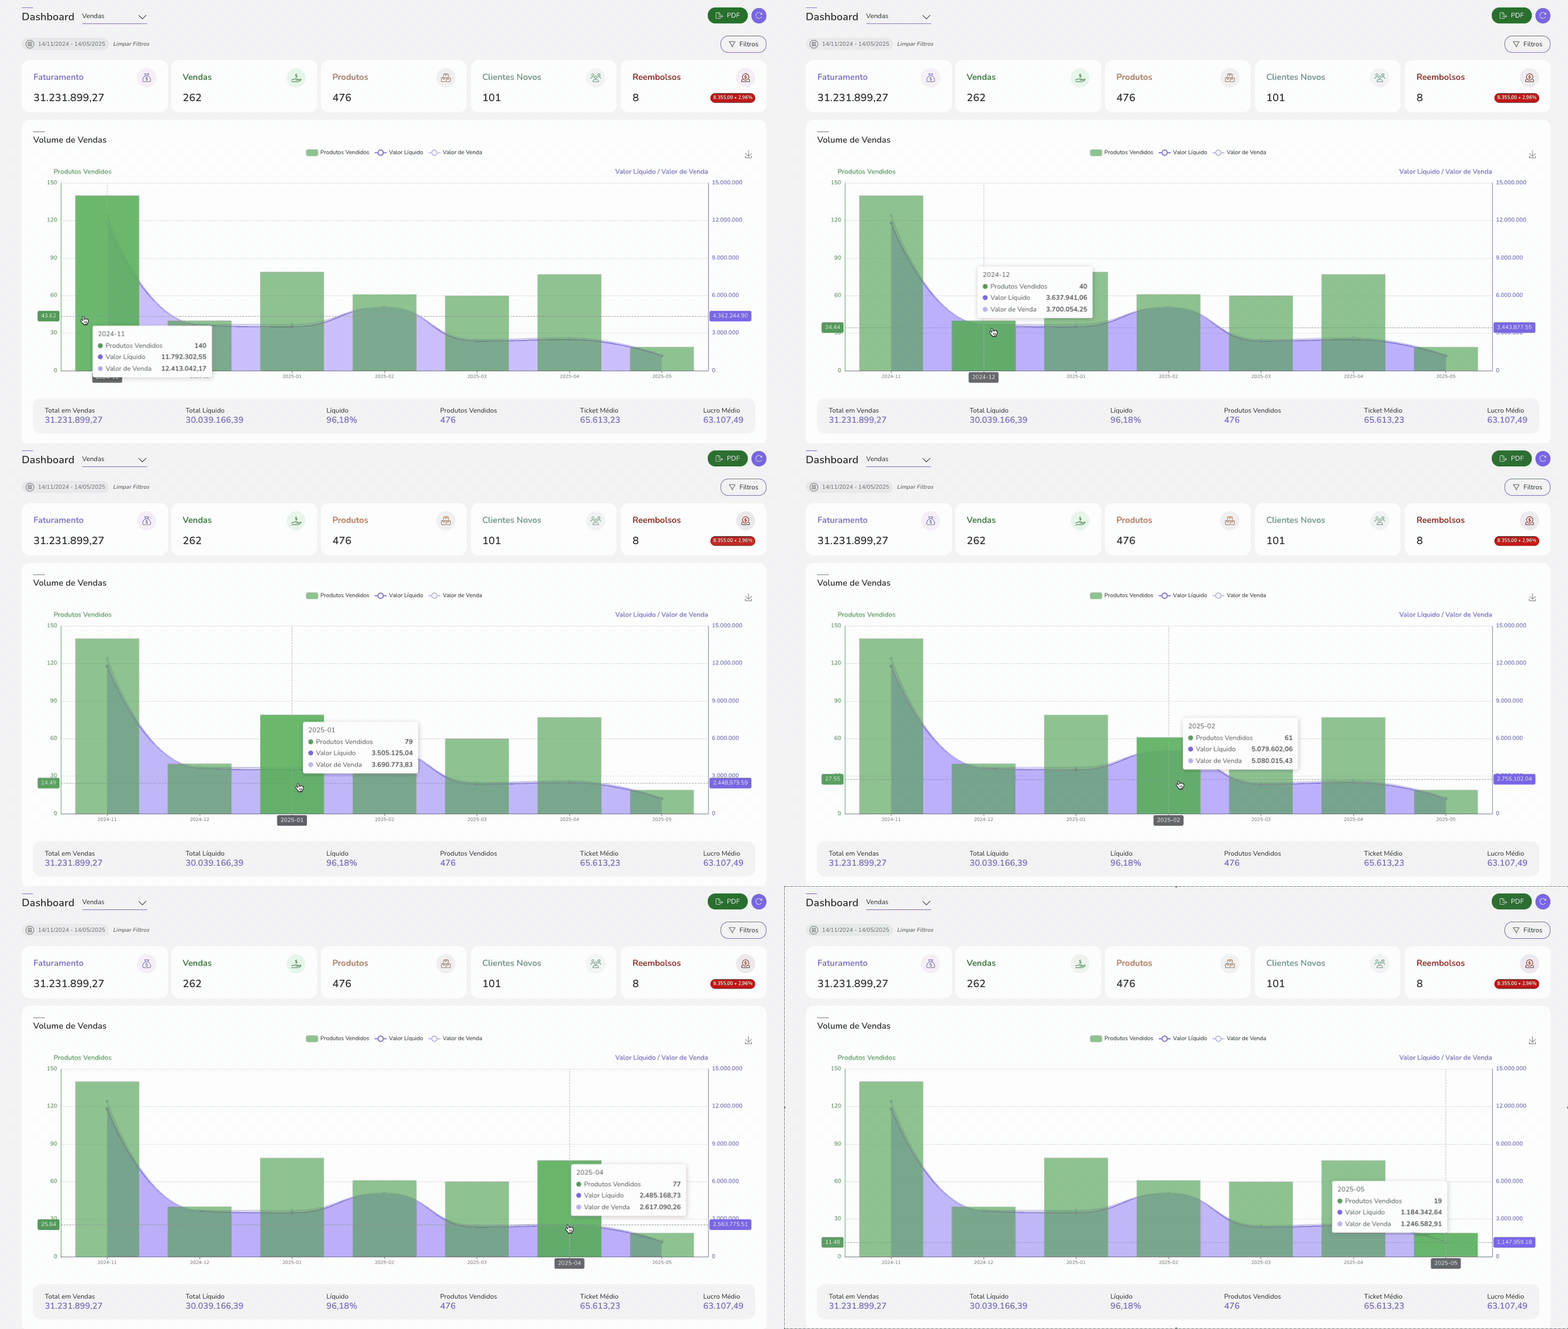
Learn more about each performance indicator by accessing the Sales Volume section in Metrics displayed in Sales Dashboards.
- Why is sales volume showing as zero on specific days?
Sales volume may appear as zero on certain days in the Sales Dashboard due to a few specific reasons:
-
Applied filters: by default, the dashboard displays data for the last 28 days - if you set a custom period, the day in question might be outside the selected range;
-
Abandoned transactions: the Sales Dashboard only considers completed sales - therefore, if only abandoned sales occurred on a specific day, the displayed volume will be zero;
-
Uncounted subscription renewals: in the Sales by Hour or Days of the Weekcharts, subscription renewals are not counted - therefore, if a specific day only had renewals, volume may show as zero in these charts;
-
Cache in data update: some information depends on confirmation sent by the payment processor and is subject to a cache of up to 5 minutes.
To analyze abandoned sales, you can filter the sales list by “abandoned” status; for a full view of subscription renewals, check the Subscriptions Dashboard.
In certain cases, time zone changes can shift sales made close to midnight to adjacent days. To obtain precise information according to your local time, you can configure your account's time zone.
- is it possible to compare different periods?
Yes. To do this, you can apply filters by period and analyze visual distribution in the chart, or you can export Sales Dashboard data for external analysis and comparison.
Sales Behavior by Period
Find answers on when and how sales happen. Guru's Sales Dashboard brings together the Sales by Hour, Sales by Days of the Week , and Sales by Statussections, combining three complementary perspectives: completion time, day of the week, and order status. This lets you analyze purchasing patterns and operational performance.
In the Sales by Hour and Sales by Day of the Week charts, subscription renewalsare not counted, as they occur at a scheduled time and would cause distortions in the chart.
- Is there significant variation in sales volume (Sales by Status) based on the combination of days of the week and peak hours? How to run this analysis?
Yes, sales performance varies significantly based on the combination of days of the week and peak hours. In these cases, consumer behavior is predictable, and completed transaction volume (with status aprovada) tends to be higher when your audience is most active.
|
Step |
DASHBOARD Action |
Strategic Result |
|
Use the Sales by Days of the Week charts and the Sales by Hour heat map to find periods with highest color intensity (highest volume of new sales). |
This establishes the period of highest traffic opportunity for your operation. |
|
Filter the Dashboard for the period identified in step 1 and analyze the Sales by Status.section. |
The percentage of approved sales out of total sales generated at peak times indicates the efficiency of your traffic and checkout at that moment. |
|
Within the peak period, observe the percentage of sales with status |
If pending payment sales volume is high during peak times, you can increase sales recovery efforts¹ immediately after that time to ensure payment completion. |
|
Compare peak hour results with off-peak hour results to calculate the percentage difference in approved sales between periods. |
This comparison justifies allocating a larger media budget and scheduling communications (e-mail, live streams) for high-performance moments. |
*Learn more about sales statuses.
¹ For this type of sending, integrations such as sales recovery can be used. Check the list of available integrations in Guru.
- How can analyzing the Sales by Hour, Sales by Day of the Week, and Sales by Status charts together help my business?
Jointly analyzing the Sales by Hour, Sales by Day of the Week , and Sales by Status charts allows you to identify the periods when your customer is most likely to make and complete a purchase.
To do this, you should identify peak days and times in the Sales by Hour section and analyze the Sales by Status section during that period to understand the quality of the generated volume.
- How to analyze sales peaks?
The volume peaks shown in the Sales by Hour and Sales by Day of the Week charts act as an opportunity calendar. With this information, you can align marketing actions and sales recovery precisely during these moments to maximize the number of sales that reach approved status.
Guru Tips:
-
Peak hours are ideal for concentrating the largest media budget, as there is greater conversion efficiency;
-
Pay attention to the sales status during peak hours - if there is an increase in sales with status
ag. pagamento, check the need to step up sales recovery immediately after this period to convert pending transactions into approved sales.
Check the list of available integrations in Guru to set up sales recovery integrations.
Sales by Hour
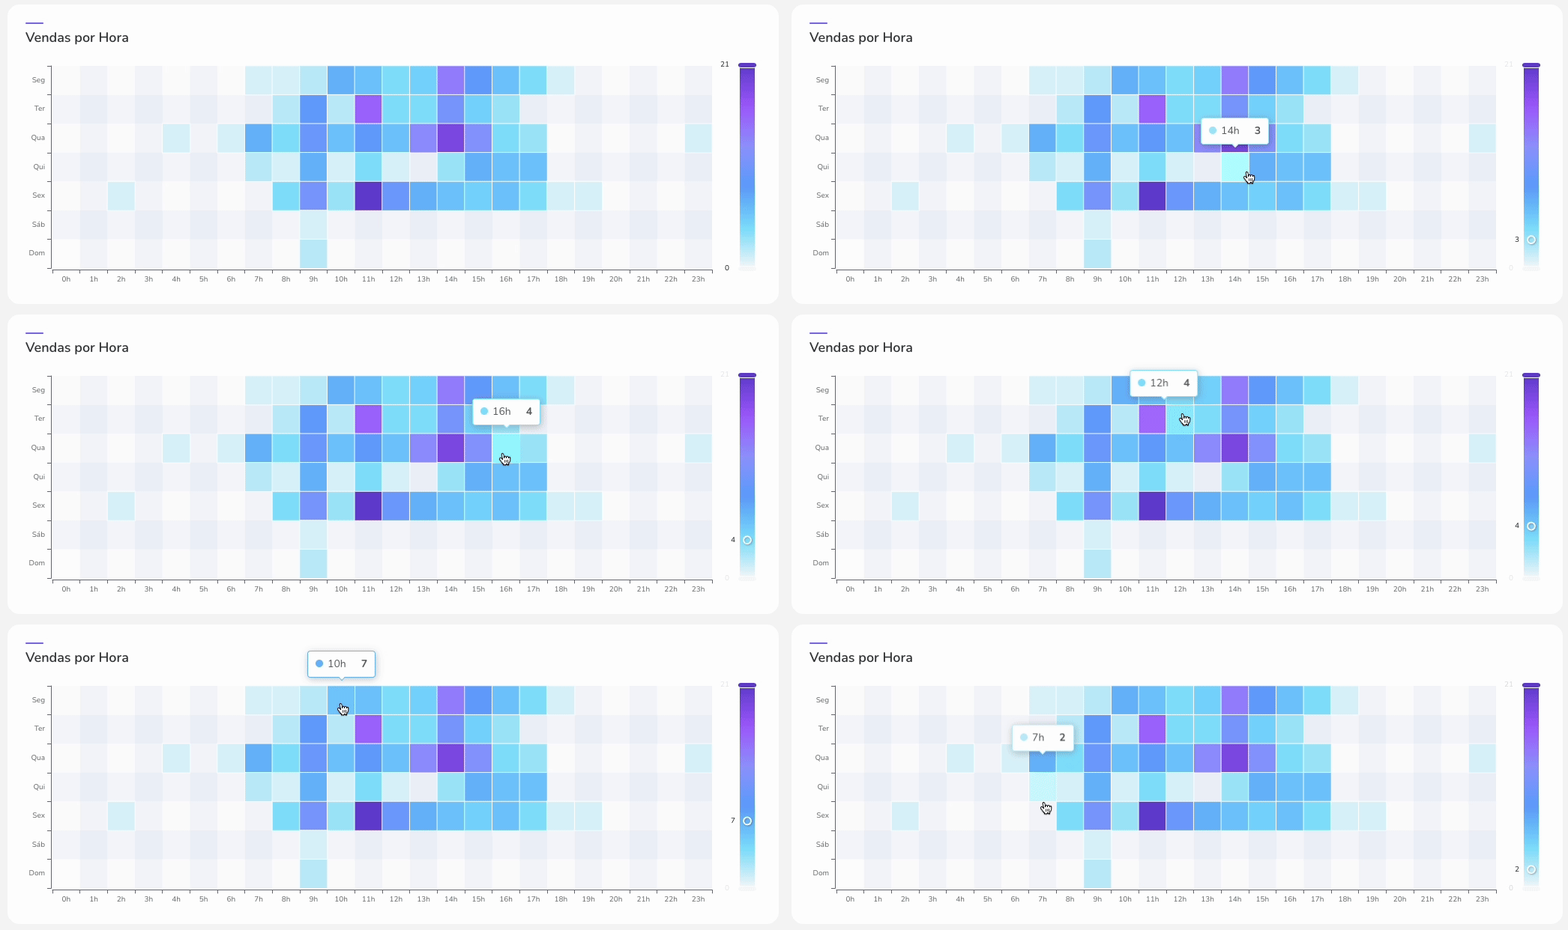
- How to interpret the Sales by Hour heat map?
The key to reading the Sales by Hour heat map is the intensity of the square's color.
That is:
-
Cores darker colors indicate the days and times with the highest volume of new sales in the filtered period; and
-
cores lighter colors indicate a lower sales volume.
Actions to leverage the heat map
-
Based on the best sales times, you can make strategic decisions, such as directing the largest investment in ads and paid traffic campaigns to peak and high-conversion days and times - you can integrate with ad platforms to create automated and optimized campaigns;
-
You can manage the sending of promotional messages so they reach customers when they are most inclined to make a purchase - activate and customize transactional emails.
To see the exact volume of new sales on a specific day and time, simply hover your mouse over the square of interest.
- Do the displayed times account for my time zone?
Yes, sales displayed by hour account for your account's time zone.
To obtain accurate information according to your local time, you can configure your account's time zone.
Sales by Day of the Week
- How can sales data by day of the week help my business?
By identifying the days of the week on which your operation generates the highest volume of new sales, you can focus your marketing efforts on the period with the highest conversion.
In practice, you optimize your marketing efforts by running live streams, launching offers, or sending email marketing. Additionally, you can schedule the activation or budget increase for paid ads to coincide with days when purchase intent is highest - to do this, you can integrate with ad platforms to create automated and optimized campaigns.
You can use the sales Dashboard filters to view sales performance by day of the week for a specific period.
Sales by Status
- Which statuses are displayed in the Sales by Status section?
The chart in the Sales by Status section represents the proportion of all sales made in the desired period by transaction status*, including: aprovada, cancelada, expirada, reembolsada, reclamada, ag. pagamento , and boleto impresso.
Guru Tip: To check the percentage for each status, hover your mouse over the desired title.
*it is important to note that this chart does not count subscription renewals, as these occur at a scheduled time and including them would cause distortions in the chart.
Access and learn more about possible sales statuses.
Payment Method Performance
Answer your questions about the payment methods displayed in the Sales Dashboard. With this data, you can analyze how each payment method contributed to the total sales volume in the selected period.
- Which payment methods are displayed in this section?
This section displays the payment methods actually used by customers for sales recorded in the selected period, such as:
-
credit card: payments made by card, with immediate approval or after security checks;
-
bank slip: payments made via bank slip, with confirmation after clearance;
-
direct debit: automatic debit transactions from an account;
-
Pix: payments made via Pix.
In Guru, you can filter the Sales Dashboard to access specific information for the payment methods you wish to check.
- How can analyzing payment methods impact my business?
Analyzing payment methods in the Sales Dashboard allows you to understand how customers complete their purchases and identify opportunities to increase conversions and reduce lost sales.
-
Targeted strategies: by identifying customer preferences, you can create targeted strategies for each method - for instance, encouraging methods with higher acceptance or adjusting the payment offering based on audience behavior;
-
Sales recovery: a high volume of bank slips may indicate orders pending confirmation - this suggests a need for reminder campaigns, remarketing, or recovery automation;
-
Approval rate comparison: by analyzing conversions by payment method, you can compare the approval rate between methods - this helps identify which perform better and which require adjustments, such as checkout optimization or offering alternatives to avoid declines.
In summary, analyzing payment methods turns data into actionable steps to improve customer experience, increase conversion rates, and maximize business results.
If you conclude that there are many abandoned sales, uncompleted payments, or many declined sales due to insufficient card balance, consider offering other payment methods to the customer by integrating with other payment processors.
- Are issued but unpaid bank slips counted?
No. Issued bank slips that were not paid are not counted as sales in the Payment Methods. Section. Only transactions with approved or paid status are included in the values and volumes displayed in the Sales Dashboard.
- Do declined payment attempts influence performance by payment method?
No. Declined payment attempts, regardless of the payment method used (card, Pix, or bank slip), are not counted as sales in the Payment Methods.section.
Only approved transactions that actually generated sales are considered.
Declined attempts are analyzed separately in specific sections of the Sales Dashboard, such as Approval by Payment Method and Decline Reasons.
Payment Processor Analysis
Find answers to your questions about the performance and distribution of your sales across different marketplaces (payment processors) used in your operation. With this data, you can evaluate performance and identify which processor is generating a higher proportion of sales and revenue; optimize checkout traffic distribution; and understand the impact of each marketplace on your revenue, making cost management easier.
- What does the marketplaces chart represent and how can it help me boost results?
The marketplaces chart in the Sales Dashboard represents the proportion of sales made through each payment processor.
You can use this data to:
-
prioritize distribution - direct more traffic to the marketplace that shows a higher success rate;
-
optimize costs - evaluate whether the fees charged by the higher-performing processor outweigh those of others, ensuring higher net revenue.
Discover the payment processors available in Guru.
- Can I compare different payment processors in the same period?
Yes. The marketplaces chart in the Sales Dashboard allows you to compare the performance of payment processors over the same date range. This makes it easy to evaluate which processor shows better results in terms of approval and sales volume.
- What does Guru consider in the data displayed for each marketplace?
For each marketplace, Guru considers the information returned at the time of the payment attempt, including attempt volume, approved transactions, and sales statuses.
This data is used to consolidate the metrics displayed in the Sales Dashboard and allows comparing performance across the different platforms used.
You can filter Sales Dashboard information by marketplace to view specific data.
Customer self-reported origin
Find answers about your customers' discovery origin in a way that differs from technical tracking: self-attribution provides valuable insight into the channels that led customers to you, as reported by themselves.
- What does sales self-attribution mean?
The Self-Attribution section of Guru's Sales Dashboard refers to information about how your customers found your product or service, provided directly by the customer during the purchase or registration process.
Access and configure self-attribution on the invoice in your Guru Checkout.
- How to activate sales self-attribution?
To activate self-attribution in Guru Checkout, you must access the Guru admin to enable this option. When configuring, you can enter the question text that the buyer will see on the invoice and define the response options available for selection.
If you want to define self-attribution options on the invoice, enable this option in admin by going to Settings, then Checkout, and under Appearance, toggle on Self-attribution on invoice.
Self-attribution can be configured at the global level, product level, or offer level.
- Why do some sales not have self-attribution?
Some sales do not have self-attribution because it was not configured, as it does not appear automatically at checkout.
If you want to define self-attribution options on the invoice, enable this option in admin by going to Settings, then Checkout, and under Appearance, toggle on Self-attribution on invoice.
Self-attribution can be configured at the global level, product level, or offer level.
- Does self-attribution replace the origin data sent by checkout?
No. self-attribution is the way customers indicate how they found your product or business. Official origin data continues to be sent by the default traffic origin mechanism, as reported in tracking.
In the Sales Dashboard, you can also check Sales by Origin to analyze sales grouped by traffic source.
- What is the usefulness of self-attribution metrics?
The analysis of self-attribution metrics helps you understand which channels customers themselves declare as the purchase source, capturing this information directly at transaction time.
Through them, it is possible to:
-
Identify the buyer-reported source: to do this, you must set up a question at checkout (such as “How did you hear about our product?”) - this will allow you to create more targeted messages;
-
Complement tracking data: provides perception declared by the customer, independently of tracking links, UTMs , or R.P.P.C.s.
In summary, self-attribution enriches source analysis by directly recording what the customer identifies as the channel that led them to the purchase.
Conversions by Payment Method
The Approval by payment method section shows the relationship between purchase attempts and completed sales for each payment method, highlighting which methods convert best.
- How is the conversion rate calculated?
The conversion rate for approval by payment method is calculated based on the relationship between the number of approved transactions and the total payment attempts made with each payment method during the selected period.
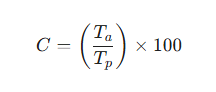
C: conversion rate (in percentage)
Ta: total approved transactions;
Tp: total payment attempts.
The calculation considers all attempts recorded at checkout, including approvals and declines, allowing you to compare performance and approval levels across different payment methods.
- What can a low conversion rate indicate?
A low conversion rate may indicate friction points at different stages of the sales funnel, especially at the time of purchase completion.
Based on metrics from the Sales Dashboard, this scenario may be related to:
-
Customer behavior and decision at checkout: a high volume of sales with statuses such as
ag. pagamentoorabandonadamay indicate indecision or lack of sufficient incentives to complete the purchase - for this, you can enable sales recovery strategies, reinforce benefits, and encourage the use of payment methods with immediate confirmation; -
Payment declines: a significant number of transactions declined due to authentication failures, for example, may indicate the need for adjustments to the payment methods offered - for this, you can diversify available payment methods, integrate more than one processor (marketplace), and monitor decline reasons for targeted adjustments;
-
Need for payment flow improvements: abandonment during the payment process may suggest areas for user experience improvement - for this, you can prioritize routing traffic to the option with the highest conversion rate.
When identifying a low conversion rate, you can perform a joint analysis of the sections Sales by Status, Payment Methods, Approval by Payment Method , and Decline Reasons to identify the main cause and direct actions to optimize performance and reduce losses in the sales funnel.
Sales Distribution by Source
Find questions to understand the sources of your sales considering information sent by the platform or checkout, such as campaigns, direct traffic, affiliate links, or internal sources.
- What metrics are displayed in Sales by Source?
In the Sales by Source section, metrics are presented that allow you to analyze sales performance according to traffic source or acquisition channel.
TheY are:
-
Source: channel associated with the sale based on tracking data - to know the source of sales, you must have created trackings; if you don't have active trackings, the source will show “without trackings”;
-
Sales: the quantity of sales;
-
Products: the quantity of products sold - quantity of products sold refers to the number of items to be delivered to the customer in the sale; for example, it is possible to make 3 sales of a 4-product kit, which will total 12 products;
-
Total Sales: the total sales amount (gross revenue);
-
Total Affiliates: the total commission amount paid to Affiliates;
-
Net Total: the total net amount to be received (after deducting all expenses/commissions);
-
Net Amount: the percentage of the net total to be received.
These metrics allow you to compare performance across different sources and identify which channels generate the greatest impact on business results.
- How are sales sources grouped?
Sales are grouped by the source identified at the moment of conversion.
When a R.P.P.C.link exists, the source displayed is the source defined when setting up that link; if there is no associated R.P.P.C., the system uses other information sent by checkout, such as transaction referral data or the source reported by the sales platform itself.
When it is not possible to identify the source, the sale is grouped as “without trackings”.
- Do UTMs influence sales sources?
Yes, UTMs directly influence tracking and the identification of sales sources displayed on the Guru Sales Dashboard.
These parameters are added to checkout links and allow tracking the user path up to purchase completion. At Guru, UTMs are primarily used in Point-to-Point Conversion Tracking (R.P.P.C.)links, allowing sales visualization on the Sales Dashboard and performance analysis by channel, campaign, or ad.
To know the source of sales, you must have created trackings. If you don't have active trackings, the source will show “without trackings”.
For analyzing the Sales by Source section, properly configuring UTMs on your R.P.P.C. links is essential. Access to learn more about using this parameter in trackings.
Plan Performance (Products)
Find answers about the product performance section (Top Selling Plans), which shows which items generated the highest volume or sales value during the period, highlighting which products perform best and contribute most significantly to your revenue.
- How can the top-selling plans ranking help my business?
The ranking lets you identify which products generate the highest sales volume and drive the best results. With this information, you can focus marketing strategies, prioritize campaigns, adjust offers, and understand which products have higher market acceptance.
You can filter the Sales Dashboard by product to view information about specific plans.
- Are products from declined transactions listed in Top Selling Plans?
No. Only approved sales are considered in the top-selling products. List. Products associated with declined, canceled, or incomplete transactions are not included in the ranking calculation.
To view declined transactions, you can consult the Decline reasons.section.
For better data visualization and analysis, you can export the Top Selling Plans spreadsheet by clicking the CSV button in the upper right corner of the section.
Payment Decline Reasons
Identify recurring patterns in customer purchase decline reasons and see alternatives to help facilitate their transactions.
- How to use decline reasons to improve my approval rate?
To improve your approval rate, you can use the decline reasons presented in the Sales Dashboard and take steps to reduce this issue, such as:
-
Optimize and diversify -if the credit card approval rate is low, consider diversifying options by promoting other payment methods such as bank slip, for example;
-
Sales Recovery - you can configure an autoresponder or a sales recovery tool to encourage customers to try a different payment method.
If you want to learn more about decline reasons, access the Sales Dashboard.
- What are the most common decline reasons?
Some of the most recurring reasons include insufficient funds, invalid data, authentication failures, anti-fraud blocks, and payment processor instability.
Among them are:
-
Credit card related declines: incorrect details, unavailable credit limit, transaction unauthorized by financial institution, bank communication failure, expired or blocked card;
-
Security and validation declines: guru's checkout also applies automatic validations to protect the payment environment, and some declines occur when the recaptcha token cannot be validated - due to issues such as refreshing the page during payment, staying inactive on the tab for too long, connection instability, and the use of ad or script blockers.
You can check the specific reason for each decline in the Sales. Panel. To do this, in the Guru admin, go to Sales in the side menu. Then open the sales details of the declined purchase and check the Reasonfield, which shows the response sent by the processor.
If necessary, you can deepen your analysis by cross-referencing this information with data on payment methods used, or with specific transaction reports, such as the Sales Report.
Affiliate Performance
In this topic you will find answers about the Top Affiliatessection, where you can view the ranking of affiliates that generated the most sales in the selected period and identify which partners are responsible for most of your revenue. This view helps you understand who drives your results and where to focus relationship and strategic efforts.
- What data is displayed in the affiliate ranking?
The ranking presents the top 10 affiliates list with the best performance in the selected period, allowing you to quickly identify which partners generated the highest impact on sales.
Affiliates are ordered starting from the highest sales volume or revenue, and the data presented in the ranking are:
-
Name: the registered affiliate's name;
-
Product: the sold product associated with the affiliate;
-
Sales: the affiliate's number of sales;
-
Products: the number of products associated with the affiliate that were sold - quantity of products sold refers to the number of items to be delivered to the customer in the sale; for example, it is possible to make 3 sales of a 4-product kit, which will total 12 products;
-
Total Sales: the total amount of all sales (gross revenue);
-
Total Commissions: the total commission amount paid to the affiliate;
-
Commission: the percentage of the net total paid to the affiliate.
This information helps quickly visualize which partners are bringing in the best results and which ones need closer follow-up.
For better data visualization and analysis, you can export your affiliate rankingspreadsheet by clicking the CSV button in the upper right corner of the section.
- How can I use affiliate ranking information in managing my business?
The Sales Dashboard, through the Top Affiliatessection, helps you manage your affiliate program.
You can use this information for strategic actions such as:
-
Evaluate total sales and commissions: you will be able to identify which affiliates deserve higher investment or bonuses for generating a larger share of revenue, and evaluate the profitability of each to ensure that commission aligns with profit margins and the sales volume generated by each partner;
-
Strengthen relationships and offer targeted training: you can strengthen partnerships with top affiliates so they increase sales even further and promote other products from your business - as well as offer support to promising affiliates outside the ranking so they recover their position and become more profitable;
-
Analyze products: you can verify which products are sold most by a given affiliate and use this insight to guide promotions and disclosures for specific items.
Thus, the Top Affiliates section helps you in the performance management process, transforming data into effective actions aimed at your business's profitability in collaboration with affiliates.
For better data visualization and analysis, you can export your affiliate rankingspreadsheet by clicking the CSV button in the upper right corner of the section.
- Which sales are considered in the affiliate ranking and why is this important for my business?
The affiliate ranking available in the Sales Dashboard is a strategic tool that ranks the partners who generated the most revenue for your business in a given period.
Based on this data, you can:
-
Strengthen relationships with high-performing affiliates - you can expand partnerships and offer growth opportunities to affiliates who generate the highest revenue;
-
Continuously monitor performance - you can identify performance drops and act quickly to recover results.
Thus, the affiliate ranking becomes an essential resource for optimizing results and scaling your partner sales strategy.
Only sales with confirmed payment, meaning approved or completed status, are considered in the ranking.
- Why doesn't an affiliate appear in the ranking?
An affiliate may not appear in the Top Affiliates list in the Sales Dashboard because the ranking considers only specific valid sales criteria and a set time period.
Thus, the main reasons are:
-
Unqualified sale status: the ranking only counts sales with approved and completed payment - meaning, sales in other statuses – pending, canceled, expired, or abandoned – are not included in the calculation;
-
Filtered period: by default, the Sales Dashboard displays data from the last 28 days - therefore, if the affiliate's valid sales occurred outside this interval, they will not be considered unless the date filter is adjusted;
-
Ranking limit: the section displays only the top 10 affiliates with the highest volume of valid sales (
aprovadaandcompleta) in the selected period.
To check the performance of an affiliate outside the Top 10 Affiliates, you can use the sales Dashboard filters to select the affiliate and period you want to consult.