
In the Leads Captures P.P.C.T. Dashboards, metrics, indicators, graphs, and performance analysis of sales results will be presented. In addition, it will gather in one place information about leads, such as clicks, new leads, cost per lead, origin of these leads, and the tracking of your campaigns.
In Guru's captured leads dashboard, you will find information such as:
-
Funnel: clear and quick view of the performance of your P.P.C.T. campaigns, clicks, new leads, cost per click (CPC), cost per lead (CPL);
-
Sources: the origins of campaigns (advertisers) that generated more leads and clicks;
-
Trackings: allows you to follow the lead's journey from the first contact to conversion.
The lead capture dashboard is a powerful tool for companies looking to improve their strategy, driving business growth through data-driven strategies.
When accessing the dashboard, you view, by default, the results of the last 28 days (4 exact weeks). If desired, you can analyze other periods applying a filter.
On this page:
-
Capture Funnel
-
Statistics
-
Sources
-
Trackings
Forms Funnel
In the Forms Funnel section, in Clicks, Leads and New Leads, you will see the number of clicks, leads, and new leads tracked during the period. In addition, you can observe the main indicators, such as:
-
Cost: displays the total campaign cost for the period;
-
CPC1: displays the cost per click of leads for the period;
-
CPL2: displays the costs generated per lead for the period;
-
New CPL: displays the new costs generated per lead for the period.

(1) CPC is calculated by dividing the total campaign cost by the number of clicks it generated.
(2) To calculate the total cost per lead (CPL), you need to sum all direct and indirect costs and divide by the total number of leads captured in a given period.
By default, the presented results consider customers from the last 28 days. If the filter is changed, only customers meeting the filtering criteria are considered.
Statistics
In the Statistics section, you can analyze the evolution of the click volume of tracked leads over a period. The information is presented in two ways.
Graph
The graph displays the variation of total clicks, total leads, new leads, and the conversion rate, which can be daily (for periods up to 31 days) or monthly (for periods over 31 days).
Performance indicators
-
Total Clicks: displays the total number of clicks tracked for the period;
-
Total Leads: displays the total number of leads tracked for the period;
-
Total New Leads: displays the total number of new leads tracked for the period;
-
Conversion Rate: displays the conversion rate of tracked leads for the period.
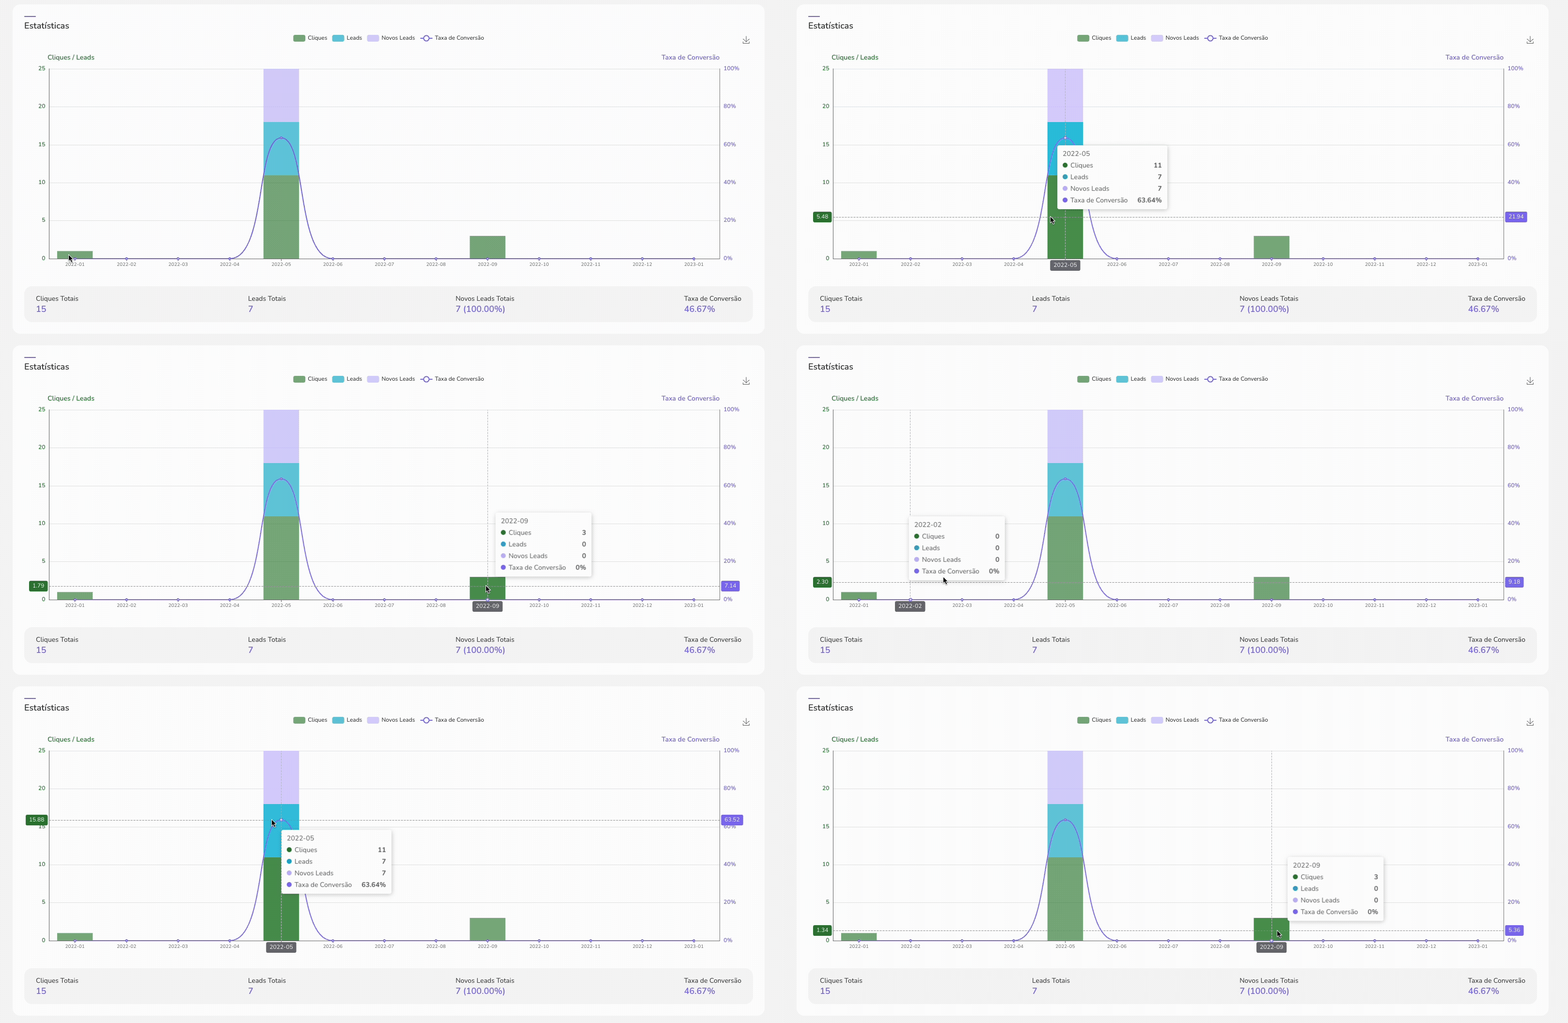
By default, the presented results consider customers from the last 28 days. If the filter is changed, only customers meeting the filtering criteria are considered.
Guru's Tip:
If desired, you can save the graph image: 
Sources
In the Sources section, it is possible to consult the origin of captured leads, grouped by traffic source, informed in the tracking link, when the P.P.C.T. are created.
For each lead, the following values are displayed:
-
Name: displays the name of the tracking source for the period;
-
Clicks: displays the number of clicks tracked for the period;
-
Leads: displays the number of leads tracked for the period;
-
New Leads: displays the total number of new leads tracked for the period;
-
Cost: displays the total campaign cost for the period;
-
CPL1: displays the costs generated per lead for the period;
-
New CPL: displays the new costs generated per lead for the period;
-
CPC2: displays the cost per click of leads for the period.
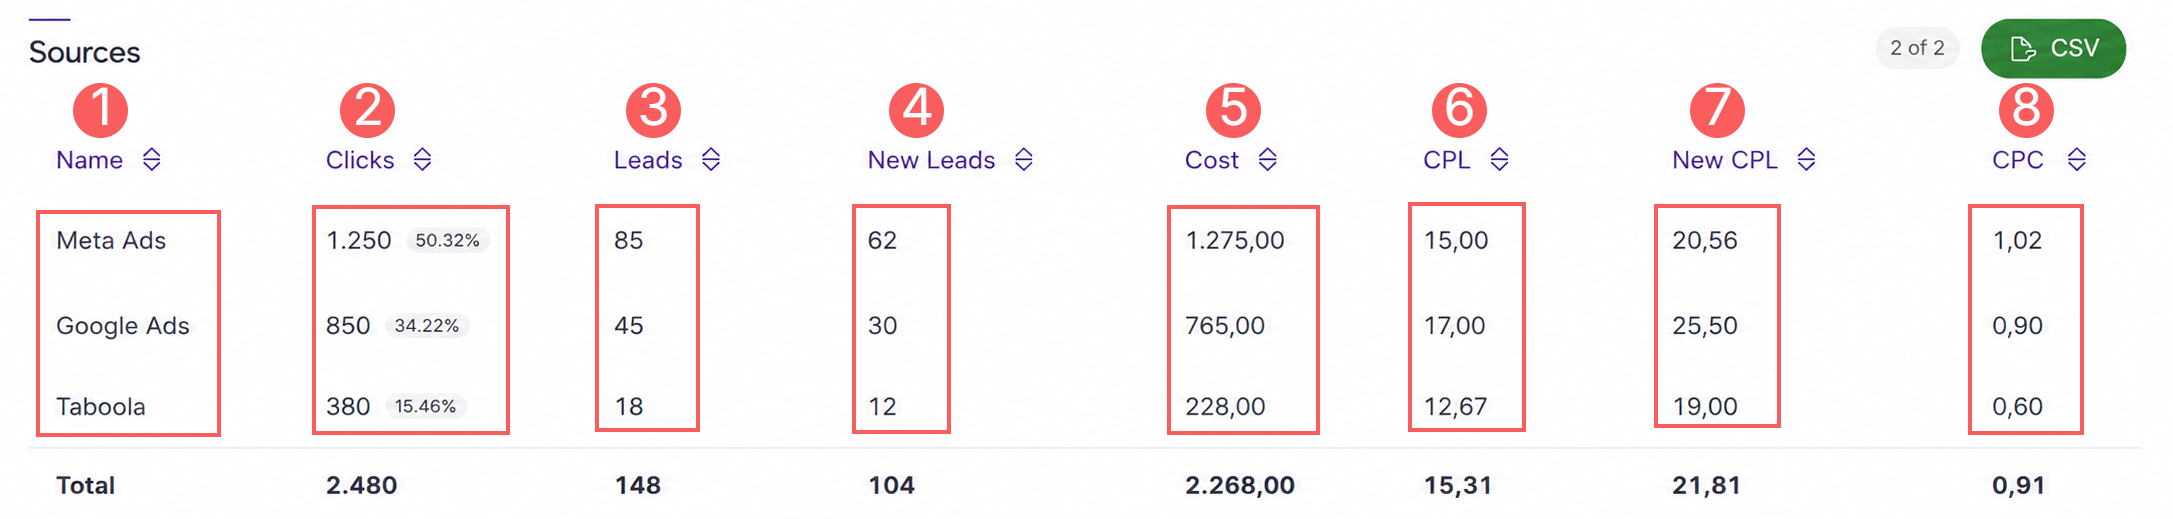
(1) To calculate the total cost per lead (CPL), you need to sum all direct and indirect costs and divide by the total number of leads captured in a given period.
(2) CPC is calculated by dividing the total campaign cost by the number of clicks it generated.
By default, the presented results consider customers from the last 28 days. If the filter is changed, only customers meeting the filtering criteria are considered.
Guru's Tip:
You can export the spreadsheet by clicking on the CSV.
Trackings
In the Trackingssection, it is possible to observe the origin of the tracking of captured leads, grouped by traffic source, informed in the tracking link, when the P.P.C.T. are created.
For each lead, the following values are displayed:
-
Name: displays the name of the tracking source for the period;
-
Publisher: displays the tracking source for the period;
-
Clicks: displays the number of clicks tracked for the period;
-
Leads: displays the number of leads tracked for the period;
-
New Leads: displays the total number of new leads tracked for the period;
-
Cost: displays the total campaign cost for the period;
-
CPL1: displays the costs generated per lead for the period;
-
New CPL: displays the new costs generated per lead for the period;
-
CPC2: displays the cost per click of leads for the period.

(1) To calculate the total cost per lead (CPL), you need to sum all direct and indirect costs and divide by the total number of leads captured in a given period.
(2) CPC is calculated by dividing the total campaign cost by the number of clicks it generated.
By default, the presented results consider customers from the last 28 days. If the filter is changed, only customers meeting the filtering criteria are considered.
Guru's Tip:
You can export the spreadsheet by clicking on the CSV.