
In the Neural A/B Checkout Tests Statistics section, you will find an in-depth view of performance indicators, helping to optimize your sales strategies, being able to visualize essential metrics such as Total Clicks, Total Sales, Total Valid Sales, and the Conversion Rate of your campaigns.
In addition to general indicators, it is possible to gain valuable visual insights, such as the Sales Per Hour chart which shows a heatmap revealing the days and times of highest sales volume, while the Sales Per Days of the Week chart highlights the days with the best conversion performance.
These features allow you to identify the best moments for your strategies, assisting in decision-making to maximize your results.
On this page:
-
Stats
-
Filter Neural A/B Checkout Test statistics
-
Manage Neural A/B Checkout Test filters
-
-
Hourly Sales
-
Weekdays Sales
Stats
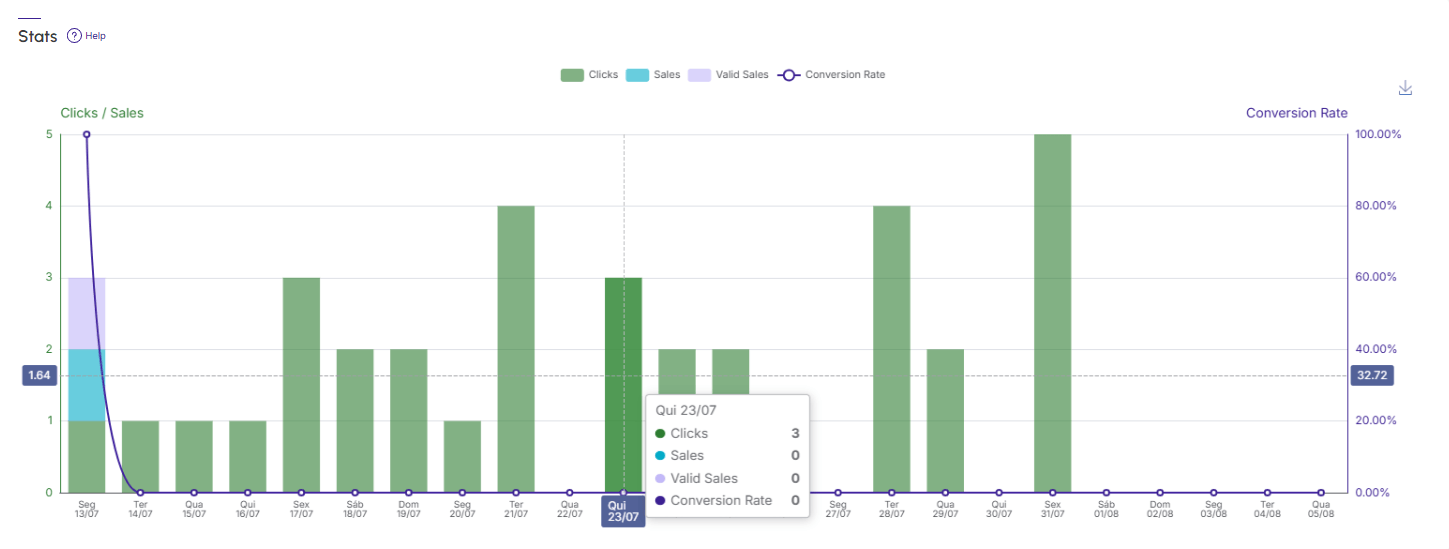
In the Stats section, you can view all information on indicators related to Neural A/B Checkout Tests. In addition, you can observe sales indicators by hour and sales by days of the week.
Steps:
1 - Access the Neural A/B Checkout Test list - a screen with the data will be displayed.
2 - In Statistics, the list displays the following information:
-
Total Clicks: displays the total clicks of sales tracked in the period;
-
Total Sales: displays the total value of all sales tracked in the period;
-
Total Valid Sales: displays the total valid sales tracked and completed in the period;
-
Conversion Rate: displays the conversion rate of sales tracked and completed in the period.
Guru's Tip:
You can export the spreadsheet by clicking on the CSV.
Filter Neural A/B Checkout Test statistics
You can filter the data using the statistics.
By default, the results presented consider customers from the last 28 days. If the filter is changed, only customers who meet the filtering criteria are considered.
Steps:
1 - Access the Neural A/B Checkout Test list - a screen with the data will be displayed.
2 - In Statistics, click on Filters.
3 - Fill in one or more filter options:
-
Period: searches for A/B checkout tests with start and end dates (the verified test field corresponds to the option selected in Created at).
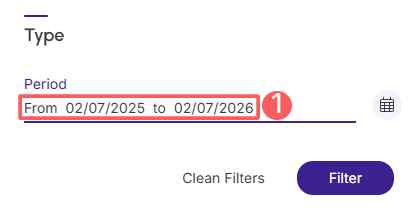
4 - Click on Filter.
To remove the applied filters, just click on Clean Filters.
Manage Neural A/B Checkout Test filters
You can clear the filters without accessing the Filters icon again, facilitating the removal of applied filters.
Clean applied filters
You can remove the applied filters without needing to click on the filters icon.
Steps:
1 - In the side menu, go to A/B Test, and then click on Checkouts. After the page loads, a list with all A/B Checkout Tests will be displayed.
2 - Click on the A/B Test desired, and in Statistics, click on Filters.
3 - Fill in one or more filter options - apply the filters you want to consult.
4 – Then, click on Clean Filters.

Hourly Sales
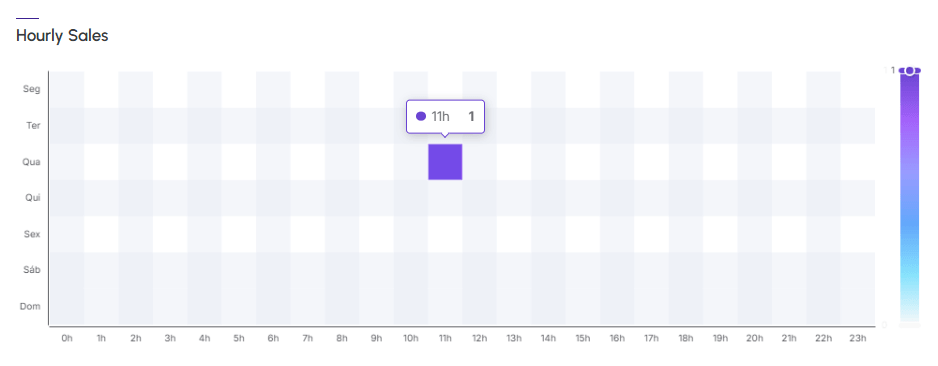
In the Hourly Sales section, a heatmap is presented showing the days and hours of the day when new tracked sales occurred.
Through the graph, it is possible to know the best days and times for new tracked sales.
Steps:
1 - Access the list of Neural A/B Checkout Tests - a screen with the data will be displayed.
2 - In Sales per hour, the graph displays the following information:
Guru Tip:
To know the volume of new sales for this period, hover the mouse over the square. The darker it is, the higher the volume of new sales.
Weekdays Sales
In the Weekdays Sales section, it is possible to consult which days of the week generate more tracked sales that converted.
Steps:
1 - Access the list of Neural A/B Checkout Tests - a screen with the data will be displayed.
2 - In Weekdays Sales, the chart displays the following information:
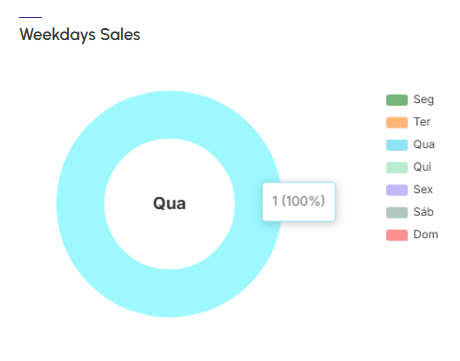
Guru Tip:
To know the volume of new sales for this period, hover your mouse over the square. The darker it is, the higher the volume of new sales.