
In the Summary P.P.C.T. Dashboard, metrics, indicators, graphs, and performance analysis of sales tracking results will be presented. In addition, it will have data displayed in graphs, tables, and other visual elements gathered in one place, allowing for a quick analysis of your business's performance.
In Guru's summary dashboard, you will find information such as:
-
Total Tracked/Untracked Sales: number of sales and the gross value of sales that converted during the period;
-
Campaign Traffic: information about campaign traffic, investments, and the ROI obtained from the invested cost;
-
Total Leads: the total leads from tracked and untracked sales;
-
Traffic Sources: the origin of traffic sources and related sales.
Summary dashboards are powerful tools you can use to make smarter decisions and achieve your goals more efficiently, in addition to providing a clear and concise view of data, allowing you to identify opportunities.
When accessing the dashboard, you view, by default, the results of the last 28 days (4 exact weeks). If desired, you can analyze other periods by applying a filter.
On this page:
-
Sales
-
Sales Quantity
-
Traffic
-
Total Leads
-
Tracked Leads
-
Untracked Leads
-
Traffic Sources
Sales
In the Sales section, you can observe the main indicators, such as:
-
Total Revenue: displays the gross value of sales tracking that converted during the period;
-
Tracked: displays the cost of campaigns linked to a tracking, which converted during the period;
-
Untracked: displays the cost of campaigns not linked to any tracking, which converted during the period.
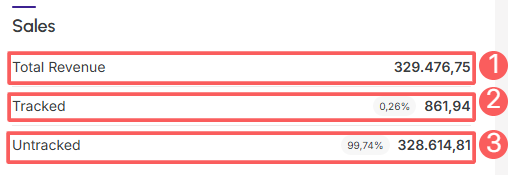
By default, the presented results consider customers from the last 28 days. In case of filter alteration, only customers who meet the filtering criteria are considered.
Sales Amount
In the Sales Amount section, you can observe the main indicators, such as:
-
Sales: displays the number of sales that converted during the period;
-
Tracked: displays the cost of campaigns linked to the number of tracked sales that converted during the period;
-
Untracked: displays the cost of campaigns not linked to any tracking, which converted during the period.
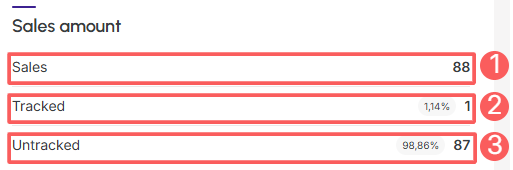
By default, the presented results consider customers from the last 28 days. In case of filter alteration, only customers who meet the filtering criteria are considered.
Traffic
In the Traffic section, you can observe the main indicators, such as:
-
Total Investment: displays the total invested in campaigns, summing the tracked and untracked columns;
-
Matched: displays the cost of linked tracked campaigns during the period;
-
Unmatched: displays the cost of campaigns not linked to any tracking during the period;
-
General ROI: displays the return on total investment in campaigns.
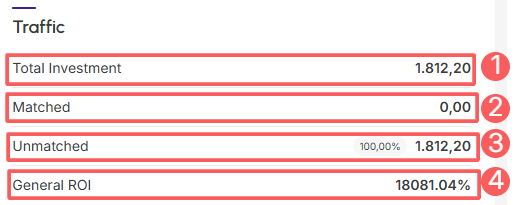
By default, the presented results consider customers from the last 28 days. In case of filter alteration, only customers who meet the filtering criteria are considered.
Total Leads
In the Total Leads section, you can observe the main indicators, such as:
-
Total: displays the total of tracked and untracked leads during the period;
-
New: displays the new tracked and untracked leads during the period;
-
Old: displays the old tracked and untracked leads during the period.
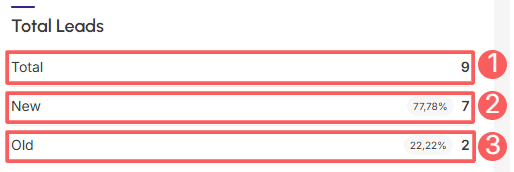
By default, the presented results consider customers from the last 28 days. In case of filter alteration, only customers who meet the filtering criteria are considered.
Matched Leads
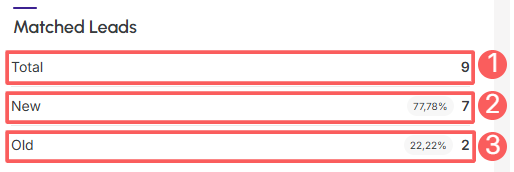
In the Matched Leads section, you can observe the main indicators, such as:
-
Total: displays the total of tracked leads during the period;
-
New: displays the new tracked leads during the period;
-
Old: displays the old tracked leads during the period.
By default, the presented results consider customers from the last 28 days. In case of filter alteration, only customers who meet the filtering criteria are considered.
Unmatched Leads
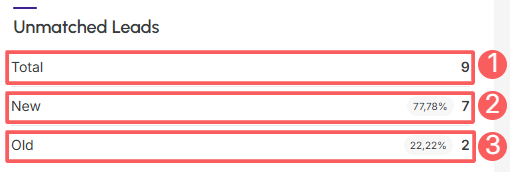
In the Unmatched Leads section, you can observe the main indicators, such as:
-
Total: displays the total of untracked leads during the period;
-
New: displays the new untracked leads during the period;
-
Old: displays the old untracked leads during the period.
By default, the presented results consider customers from the last 28 days. In case of filter alteration, only customers who meet the filtering criteria are considered.
Traffic Sources
In the Traffic Sources section, you can observe the main indicators, such as:
-
Source: displays the origin of sales(1);
-
Sales: displays the number of sales;
-
Total Net Value: displays the total net amount to be received (after deducting all expenses/commissions);
-
Leads: displays the tracked leads during the period;
-
Investment: displays the investment of campaign costs;
-
ROI: displays the return on investment in campaigns.

(1) To know the origin of sales, you will need to have trackings created. If there are no active trackings, the origin will report “no trackings”.
By default, the presented results consider sales from the last 28 days. In case of filter alteration, only sales that meet the filtering criteria are considered.