
In the section Forms Funnel, you can view the main indicators of the Neural Sales A/B Test, checking the number of clicks, cost per sale, cost per lead, among others. You can filter the data to locate the indicators within the desired parameters.
On this page:
-
Forms Funnel
-
Filter Neural Sales A/B Test Forms Funnel
-
Manage Neural Sales A/B Test Forms Funnel filters
-
-
Statistics
-
UTMs
Forms Funnel
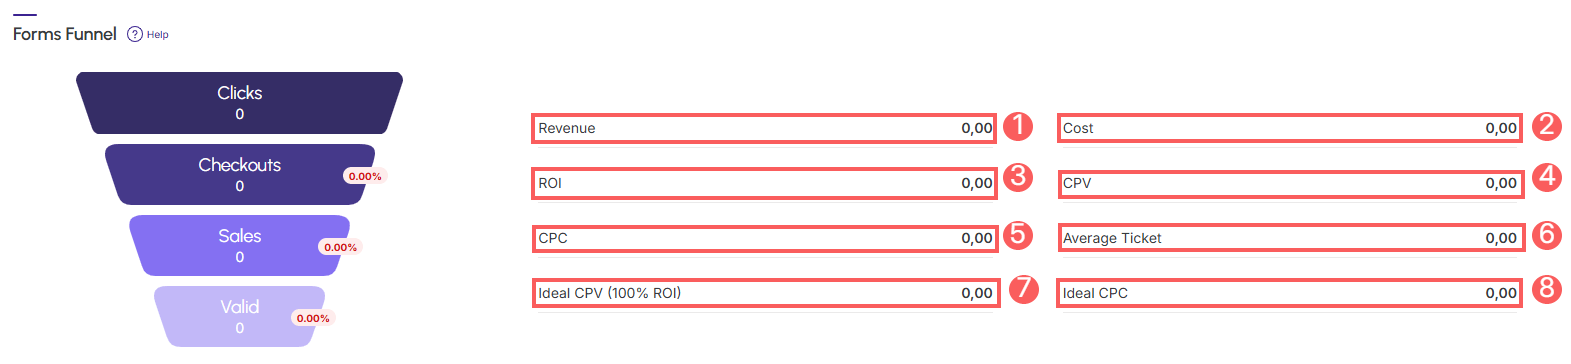
In the section Forms Funnel, you can view the main indicators of the Neural Sales A/B Test, such as clicks, checkouts, sales, valid sales, revenue, costs, ROI, CPV, CPC, Average Ticket, Ideal CPV (ROI) and Ideal CPV.
Steps:
1 - Select the Neural Sales A/B Test list - a screen with the data will be displayed.
2 - In Forms Funnel, the list displays the following information:
-
Revenue: displays the total sum of sales made in the period;
-
Costs: displays the total campaign costs in the period;
-
ROI: displays the invested ROI of valid sales in the period;
-
CPV: displays the cost per sale;
-
CPC1: displays the cost per lead clicks in the period;
-
Average Ticket2: displays the average value of each sale in the period (total divided by the number of sales);
-
Ideal CPV (ROI)3: displays the cost of ROI per ideal sale;
-
IdealCPC: displays the ideal cost per lead clicks.
(1) CPC is calculated by dividing the total campaign cost by the number of clicks it generated.
(2) The average ticket is the result of dividing total sales by the number of transactions within the selected period).
(3) The Ideal CPV would be (ROI (invested value) x CPC (cost per lead).
Filter Neural Sales A/B Test Forms Funnel
You can filter the data using the forms funnel.
By default, the presented results consider customers from the last 28 days. If the filter is changed, only customers who meet the filtering criteria are considered.
Steps:
1 - Select the Sales Neural A/B Test list - a screen with the data will be displayed.
2 - In Forms Funnel, click on Filters.
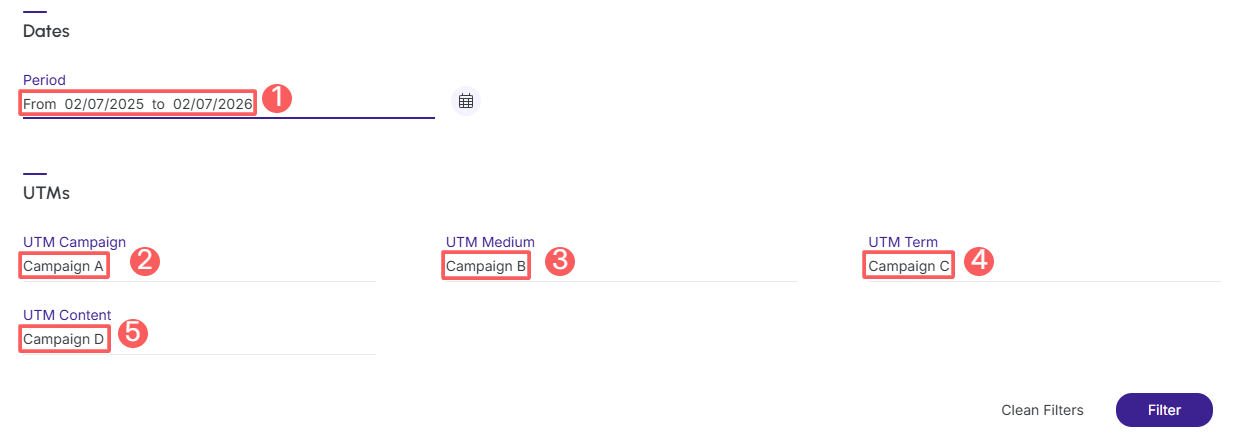
3 - Fill in one or more filter options:
-
Period: searches for sales with start and end dates - if desired, use the predefined time range buttons;
-
UTM Campaign: value of the UTM Campaign parameter passed in the sales neural A/B test link;
-
UTM Medium: value of the UTM Medium parameter passed in the sales neural A/B test link;
-
UTM Term: value of the UTM Term parameter passed in the sales neural A/B test link;
-
UTM Content: value of the UTM Content parameter passed in the sales neural A/B test link.
4 - Click on Filter.
To remove the applied filters, just click on Clear Filters.
Manage the Forms Funnel filters of the Sales A/B Test
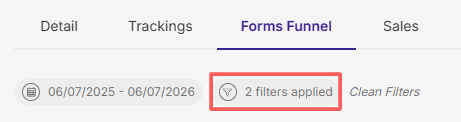
You can check the number of applied filters when using the filters to view the desired information. This feature is useful if you want to check how many filters have been applied.
In addition, it is possible to clear the filters without accessing the Filters icon again, facilitating the removal of applied filters.
Consult applied filters
You can check the number of applied filters.
Steps:
1 - Select the Sales Neural A/B Test list - a screen with the data will be displayed.
2 - In Forms Funnel, click on Filters.
3 - Fill in one or more filter options - apply the filters you want to consult.
4 - Next, the number of applied filters will appear on the screen.
If you want to apply other filters, click Filter Sales A/B Test Forms Funnel.
Clean applied filters
You can remove applied filters without needing to click the filter icon.
Steps:
1 - Select the Sales Neural A/B Test list - a screen with the data will be displayed.
2 - In Forms Funnel, click on Filters.
3 - Fill in one or more filter options - apply the filters you want to consult.
4 – Next, click on Clean Filters.
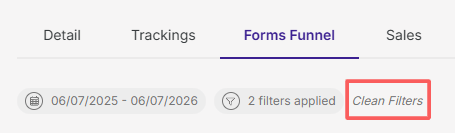
If you want to apply other filters, click Filter Sales A/B Test Forms Funnel.
Stats
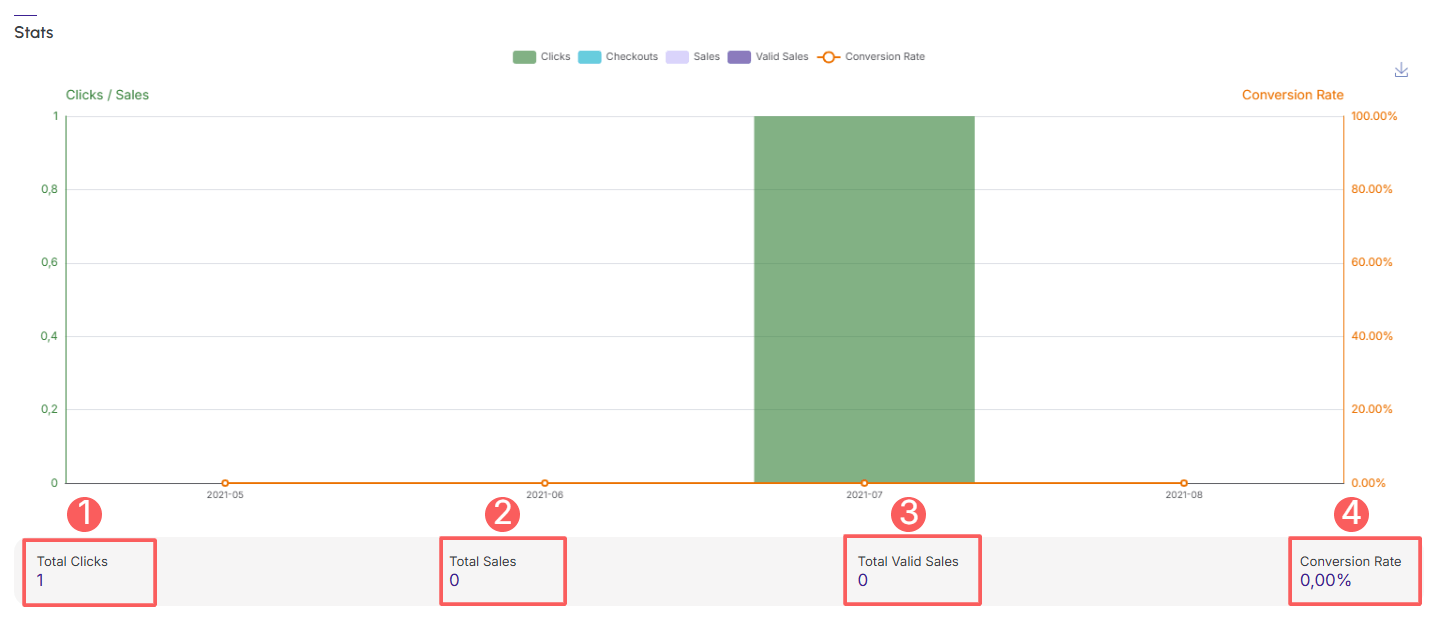
In the Stats section, you have a consolidated view of the main performance indicators related to your Sales Neural A/B Test.
Steps:
1 - Select the Sales Neural A/B Test list - a screen with the data will be displayed.
2 - In Stats, the list displays the following information:
-
Total Clicks: displays the total number of clicks for sales registered in the period - indicates traffic volume;
-
Total Sales: displays the total sales registered in the period;
-
Total Valid Sales: displays the total valid sales registered in the period;
-
Conversion Rate: displays the conversion rate of tracked and completed sales in the period.
UTMs
In the section UTMs, you can view the tracking information, if you used UTMs in the tracking link. This feature is useful for finding the specific AB Tests you want to view.
Steps:
1 - Select the Sales Neural A/B Test list - a screen with the data will be displayed.
2 - In UTMs, the list displays the following information:
-
UTMs: displays the value of the UTM parameter inserted in the URL - identifies where the traffic came from;
-
Clicks: displays the number of clicks for tracked sales in the period;
-
Leads: displays the number of leads tracked in the period;
-
Sales: displays the number of completed sales in the period;
-
Valid: displays the number of valid sales completed in the period;
-
Revenue: displays the total revenue value in the period;
-
Cost: displays the cost value in the period;
-
CPC: displays the average cost per click for sales registered in the period;
-
ROI: displays the invested ROI of valid sales in the period.
