
The E-tickets Dashboard - Stock, presents the total e-tickets, total e-tickets sold, reserved e-tickets, and available e-tickets, based on the product group associated with the e-tickets.
On this page:
-
Indicators
-
Overview
-
Stock by Product
-
Stock by Product and Offer
Before you start, you need…
-
Have created a product group.
-
Have activated the Group for Event Management (e-tickets) option when creating the Product Group.
Indicators
In the Indicators section, you can observe the main indicators such as the total e-tickets, total e-tickets sold, reserved e-tickets, and available e-tickets, based on the product group associated with the event.
To view the information on the Dashboard, it is necessary to create a product group and activate the “Group for E-tickets event management” option in the group settings.
-
Total: displays the total e-tickets associated with the product group;
-
Sold: displays the total e-tickets sold associated with the product group;
-
Reserved: displays the reserved e-tickets associated with the product group;
-
Available: displays the available e-tickets associated with the product group.

The Dashboard tracks only one event at a time, as its visualization is always based on a Specific Product Group. IT is not possible, therefore, to view tickets for multiple events simultaneously.
Overview
In the Overview section, the chart allows you to analyze the distribution of tickets in quantity and percentage, showing the proportion of Sold, Reserved, and Available e-tickets.
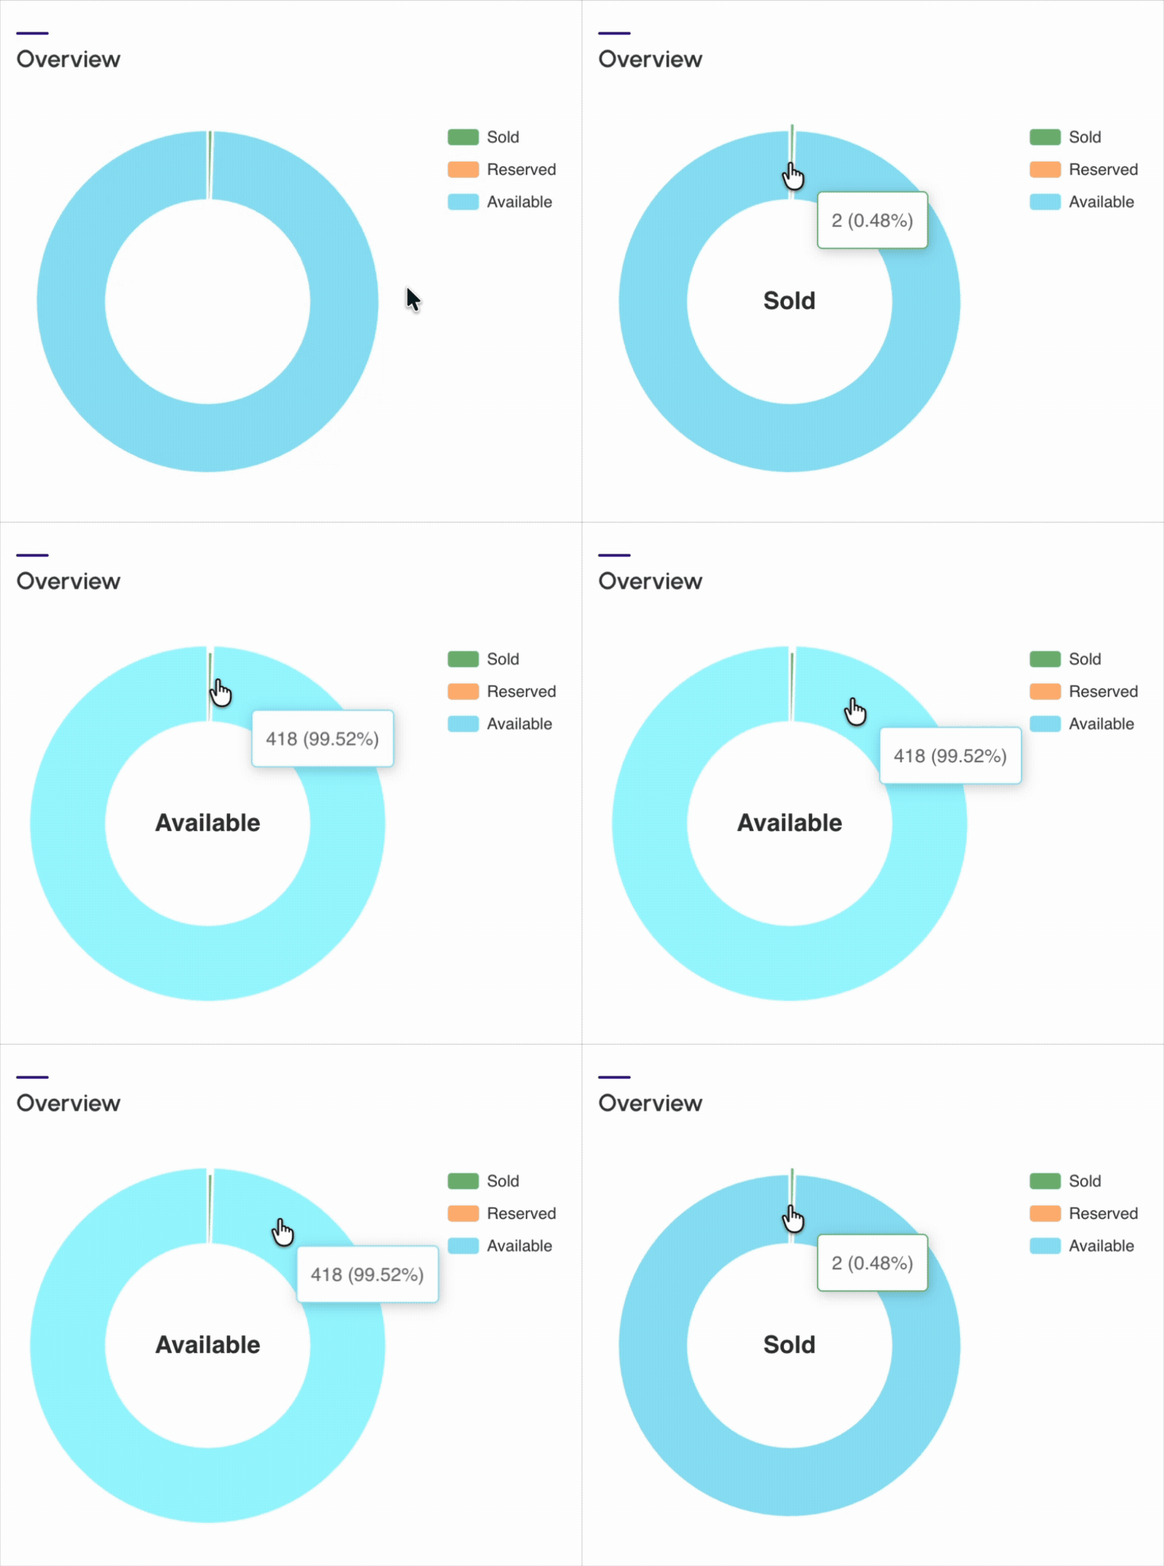
Benefits of E-ticket distribution analysis
-
Real-time stock control: access to the exact number of tickets, allowing you to observe the remaining stock and whether it is necessary to pause, increase, or resume sales;
-
Resource Allocation: a high percentage of Available, for example, may indicate that it is necessary to intensify marketing in the event's promotion;
-
Success Measurement: the percentage of tickets Sold, for example, is the main performance indicator of the event - it allows you to identify if the event is on the right track.
The Dashboard tracks only one event at a time, as its visualization is always based on a Specific Product Group. IT is not possible, therefore, to view tickets for multiple events simultaneously.
Stock by Product
In the Stock by Product section, it is possible to follow a detailed view of the distribution of tickets by product/event.
The chart presents the following information:
-
Vertical Axis: indicates the maximum stock defined and configured for the product's tickets; and
-
Horizontal Axis: lists all products (e-tickets) created for the event - for each product listed, the chart displays the stock details in their respective status Sold, Reserved, and Available.
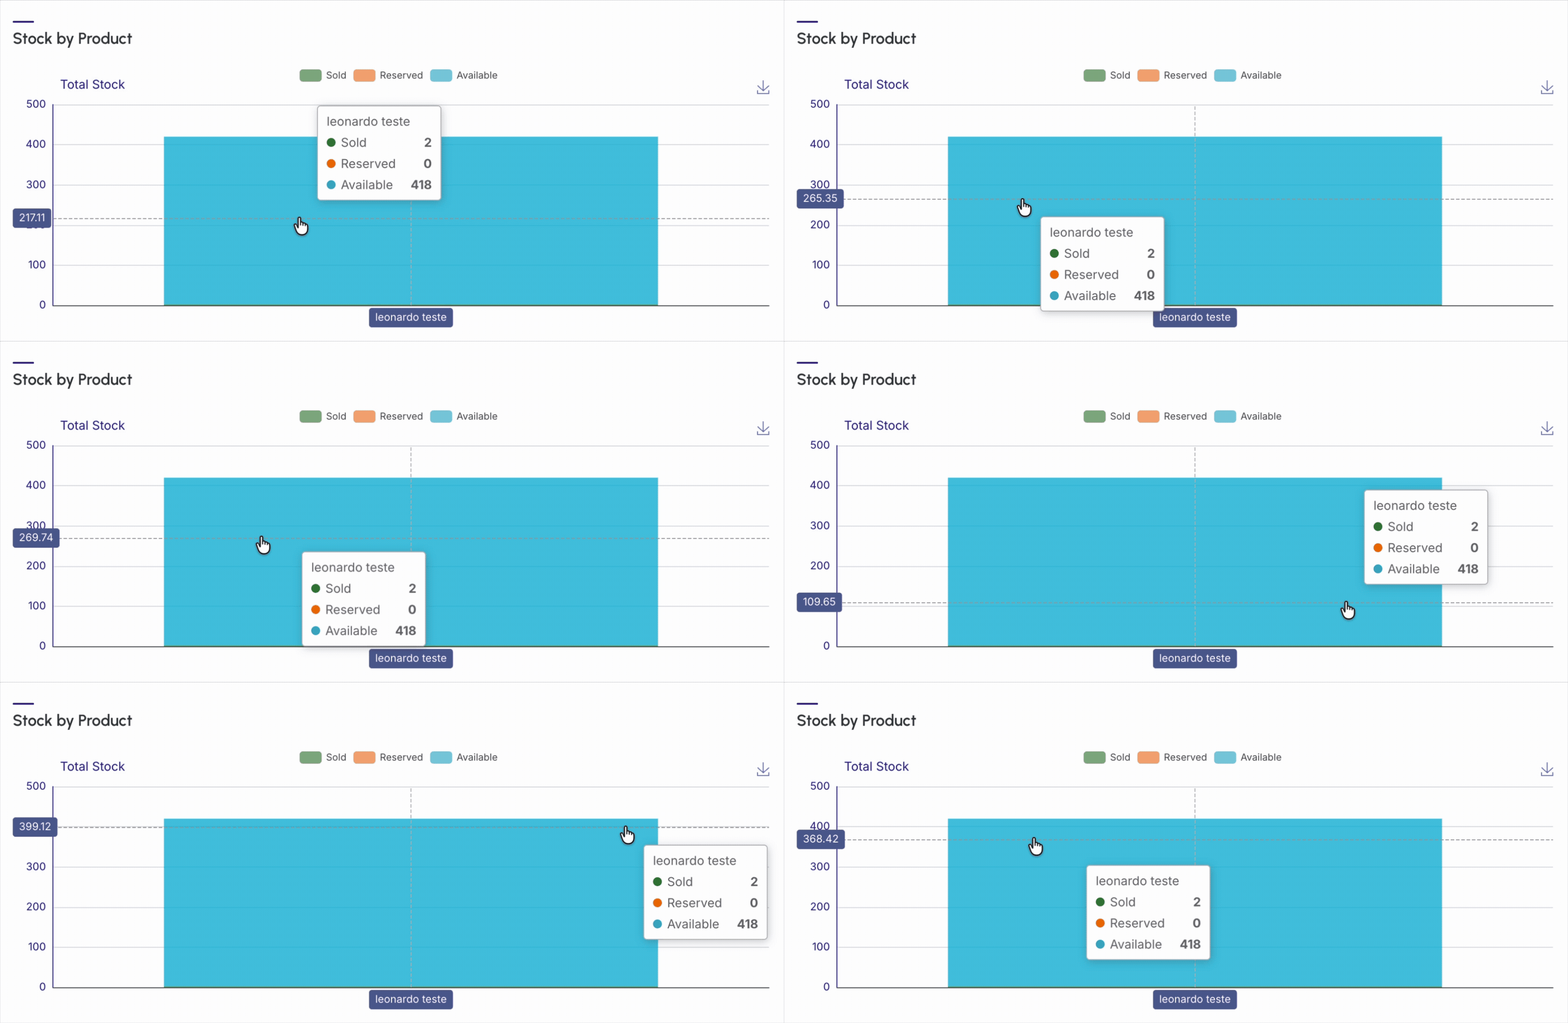
The Dashboard tracks only one event at a time, as its visualization is always based on a Specific Product Group. IT is not possible, therefore, to view tickets for multiple events simultaneously.
Guru Tip: You can export the spreadsheet by clicking on the CSV.
Stock by Product and Offer
In the Stock by Product and Offer section, you can manage tickets through the main product and its associated offers.
The list displays information about the product and the offer associated with the product, including information such as total tickets, sold tickets, reserved tickets, and available tickets.
-
Products and offers: displays the product name and the number of varied offers for the same product;
-
Total: displays the total tickets;
-
Sold: displays the total tickets sold - presents the total tickets sold by product and total tickets sold by offer;
-
Reserved: displays the total reserved tickets - presents the total reserved tickets by product and total reserved tickets by offer;
-
Available: displays the total available tickets - presents the total available tickets by product and total available tickets by offer.

Benefits of e-ticket information and control
-
Tracking: allows you to track stock and sales performance not only by the main product but also by each of its offers.
The Dashboard tracks only one event at a time, as its visualization is always based on a Specific Product Group. IT is not possible, therefore, to view tickets for multiple events simultaneously.
Guru Tip: You can export the spreadsheet by clicking on the CSV.