
In the Leads Sales P.P.C.T. Dashboard, metrics, indicators, graphs, and performance analysis of sales results will be presented.
In this section, you will be able to have a complete view of the performance of lead interaction tracking, and obtain valid information to make more assertive decisions, in order to customize and apply more relevant solutions for your business.
In Guru's sales leads dashboard, you will find information such as:
-
Capture funnel: clear view of lead capture performance and the sales conversion of these captures;
-
Conversion window: allows identifying the lead's journey and the period in which more conversion results were obtained;
-
Conversions by payment method: percentage of conversions by payment method;
-
Origin of sale and lead: percentage and tracking of the origin of sales and leads.
Sales lead tracking dashboards are tools that present important information about the performance of your lead acquisition and conversion strategies, gathering data in an organized and easy-to-understand way, allowing you to monitor the progress of your leads at each stage of the sales funnel.
When accessing the dashboard, you will see, by default, the results of the last 28 days (4 exact weeks). If desired, you can analyze other periods by applying a filter.
On this page:
-
Capture Funnel
-
Conversion Window
-
Conversions By Payment Method
-
Advertisers
-
Origin of Sale
-
Lead Origin
Forms Funnel
In the section Forms Funnel, under Captures, With Sales and In the Period you will see the number of captures, sales captured in the period, and the number of sales captured within the period. Additionally, you can observe the main indicators, such as:
-
Total Inside Period: displays the total sales within the period;
-
Total Cost: displays the total costs of captures in the period;
-
Total: displays the total sales captured in the period;
-
ROI Inside Period: displays the ROI in the period;
-
General ROI: displays the ROI invested and sold in the period.

By default, the presented results consider customers from the last 28 days. If the filter is changed, only customers who meet the filtering criteria are considered.
Conversion Window
In the section Conversion Window, you can analyze the evolution of the time period between a lead's first interaction and its conversion to a sale. The information is presented in two ways.
Graph
The graph displays the variation of total clicks, total leads, new leads, and the conversion rate, which can be daily (for periods up to 31 days) or monthly (for periods over 31 days).
-
Total Leads: displays the total number of leads tracked for the period;
-
In the Period: displays the number of leads tracked in the period;
-
Maximum Window: displays the maximum conversion period of the tracked lead;
-
Average Window: displays the average conversion period of the tracked lead;
-
Minimum Window: displays the minimum conversion period of the tracked lead.
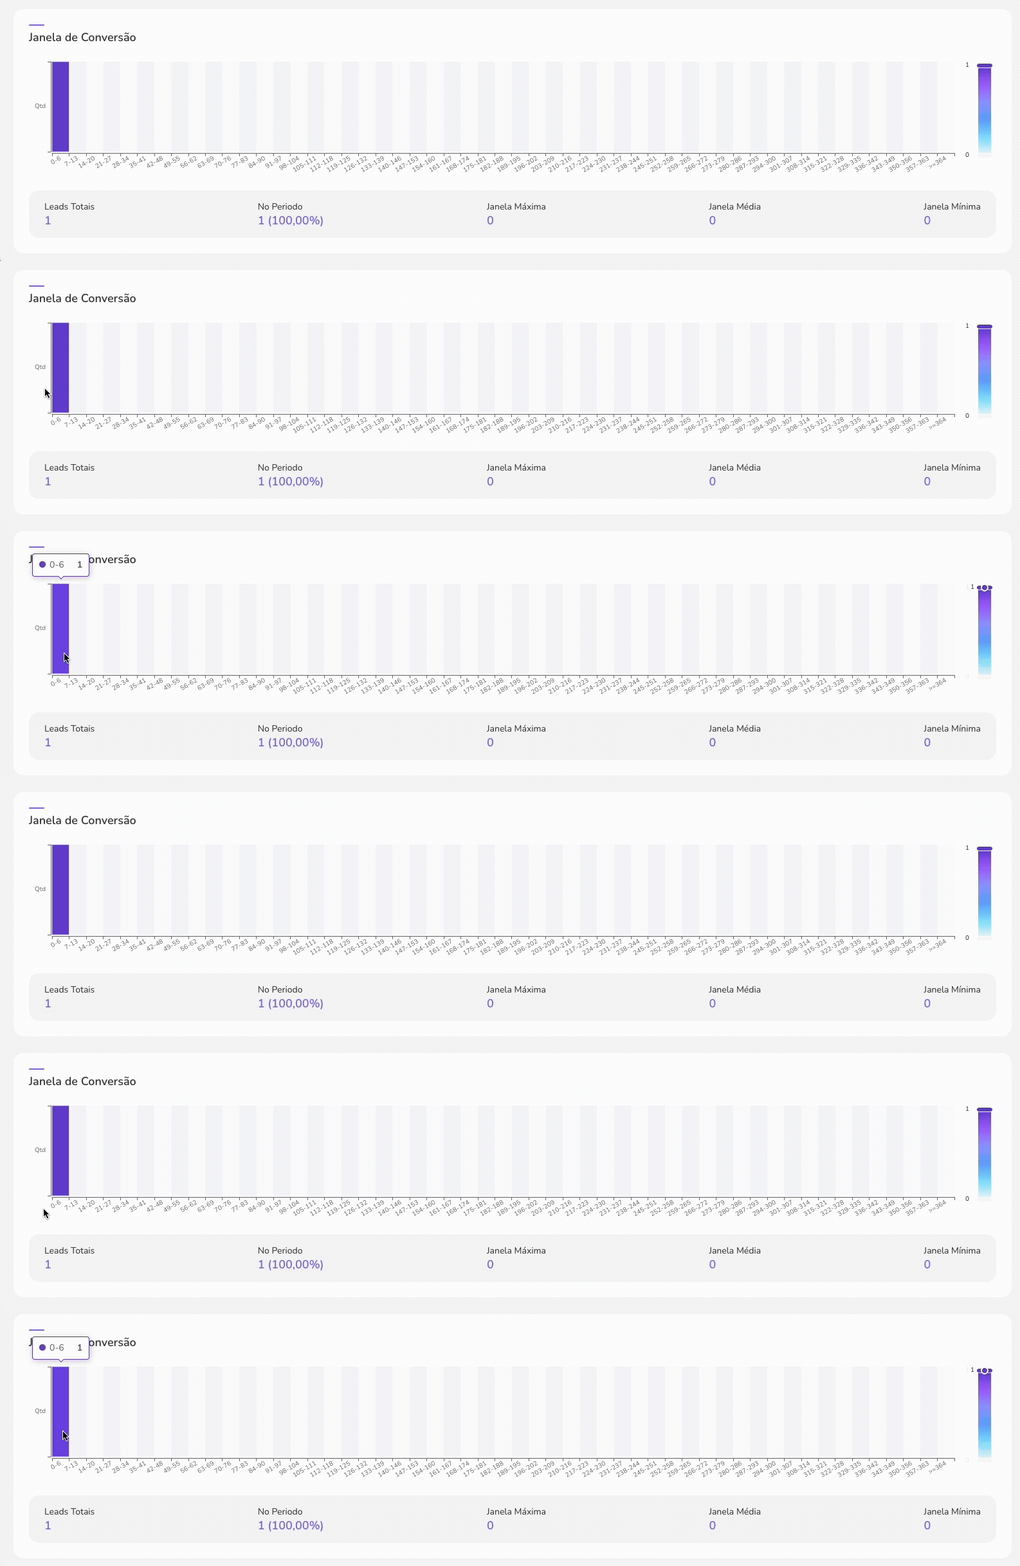
By default, the results presented consider customers from the last 28 days. If the filter is changed, only customers who meet the filtering criteria are considered.
Approval by Payment Method
In the section Approval by payment method it is possible to consult conversions by payment method used.
-
Revenue(1): total sales of payment methods;
-
Credit Card(1): percentage of sales approved for credit.
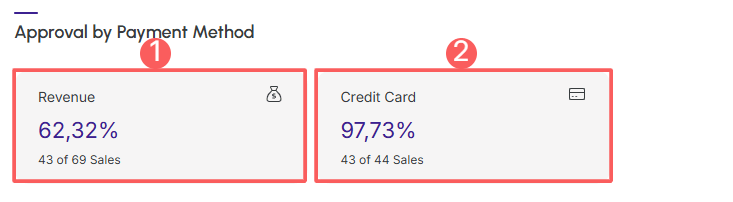
(1) The integer on the left is the total number of sales, and the one on the right is the number of approved sales.
By default, the results presented consider sales from the last 28 days. If the filter is changed, only sales that meet the filtering criteria are considered.
Advertisers
In the section Advertisers it is possible to consult the origin of lead tracking.
For each tracking origin, metrics such as:
-
Name(1): displays the name of the tracking origin for the period;
-
Sales Qty: displays the quantity of sales by tracking origin for the period;
-
Lead Qty: displays the quantity of leads by tracking origin for the period;
-
Total: displays the total sales by tracking origin for the period.

(1) To know the origin of sales, it will be necessary to have trackings created. If there are no active trackings, the origin will report “no trackings”.
By default, the results presented consider sales from the last 28 days. If the filter is changed, only sales that meet the filtering criteria are considered.
Guru's Tip:
You can export the spreadsheet by clicking on the CSV.
Sales Origin
In the section Sales Origin it is possible to consult the sales ranking grouped by Sales Origin, informed in the tracking link, when the P.P.C.T..
For each sale, metrics are displayed, such as:
-
Name(1): displays the name of the tracking source for the period;
-
Publisher: displays the tracking source for the period;
-
Sales Qty: displays the quantity of sales by tracking source for the period;
-
Lead Qty: displays the quantity of leads by tracking source for the period;
-
Total: displays the total sales by tracking source for the period.

(1) To know the origin of sales, it will be necessary to have trackings created. If there are no active trackings, the origin will inform “no trackings”.
By default, the results presented consider sales from the last 28 days. If the filter is changed, only sales that meet the filtering criteria are considered.
Guru's Tip:
You can export the spreadsheet by clicking on the CSV.
Lead Source
In the Lead Source section, it is possible to consult the sales ranking grouped by lead source, informed in the tracking link, when the P.P.C.T. .
For each lead, metrics are displayed such as:
-
Name(1): displays the name of the tracking source for the period;
-
Publisher: displays the tracking source for the period;
-
Sales Qty: displays the quantity of sales by tracking source for the period;
-
Lead Qty: displays the quantity of leads by tracking source for the period;
-
Total: displays the total sales by tracking source for the period.

(1) To know the origin of sales, it will be necessary to have trackings created. If there are no active trackings, the origin will inform “no trackings”.
By default, the results presented consider sales from the last 28 days. If the filter is changed, only sales that meet the filtering criteria are considered.
Guru's Tip:
You can export the spreadsheet by clicking on the CSV.