
In the Checkout Dashboard P.P.C.T., metrics, indicators, graphs, and performance analysis of sales results will be presented.
In this section, you will be able to have a complete view of your sales performance and make more assertive decisions to optimize your processes and increase your sales.
In Guru's checkout dashboard, you will find information such as:
-
Total clicks: percentage of customers who start checkout but do not complete the purchase;
-
Average sales time per hour and weekly: average sales time per hour and also per week;
-
Best-selling products: percentage of best-selling products.
Checkout dashboards are valuable tools for you to optimize your business's purchase completion process, increase conversion rates, and improve the customer experience. By observing detailed information about checkout performance, it will be possible to make more strategic decisions that achieve better results in your online sales.
When accessing the dashboard, you view, by default, the results of the last 28 days (4 exact weeks). If desired, you can analyze other periods by applying a filter.
On this page:
-
Statistics
-
Sales Per Hour
-
Sales By Days of the Week
-
Products
Statistics
In the Statistics section, you can observe the main indicators, such as:
-
Total Clicks: displays the total clicks of tracked sales in the period;
-
Total Sales: displays the total value of all tracked sales in the period;
-
Total Valid Sales: displays the total valid sales tracked and completed in the period;
-
Conversion Rate: displays the conversion rate of tracked and completed sales in the period.
By default, the presented results consider customers from the last 28 days. In case of filter alteration, only customers who meet the filtering criteria are considered.
Guru's Tip:
If desired, you can save the chart image: 
Sales per Hour
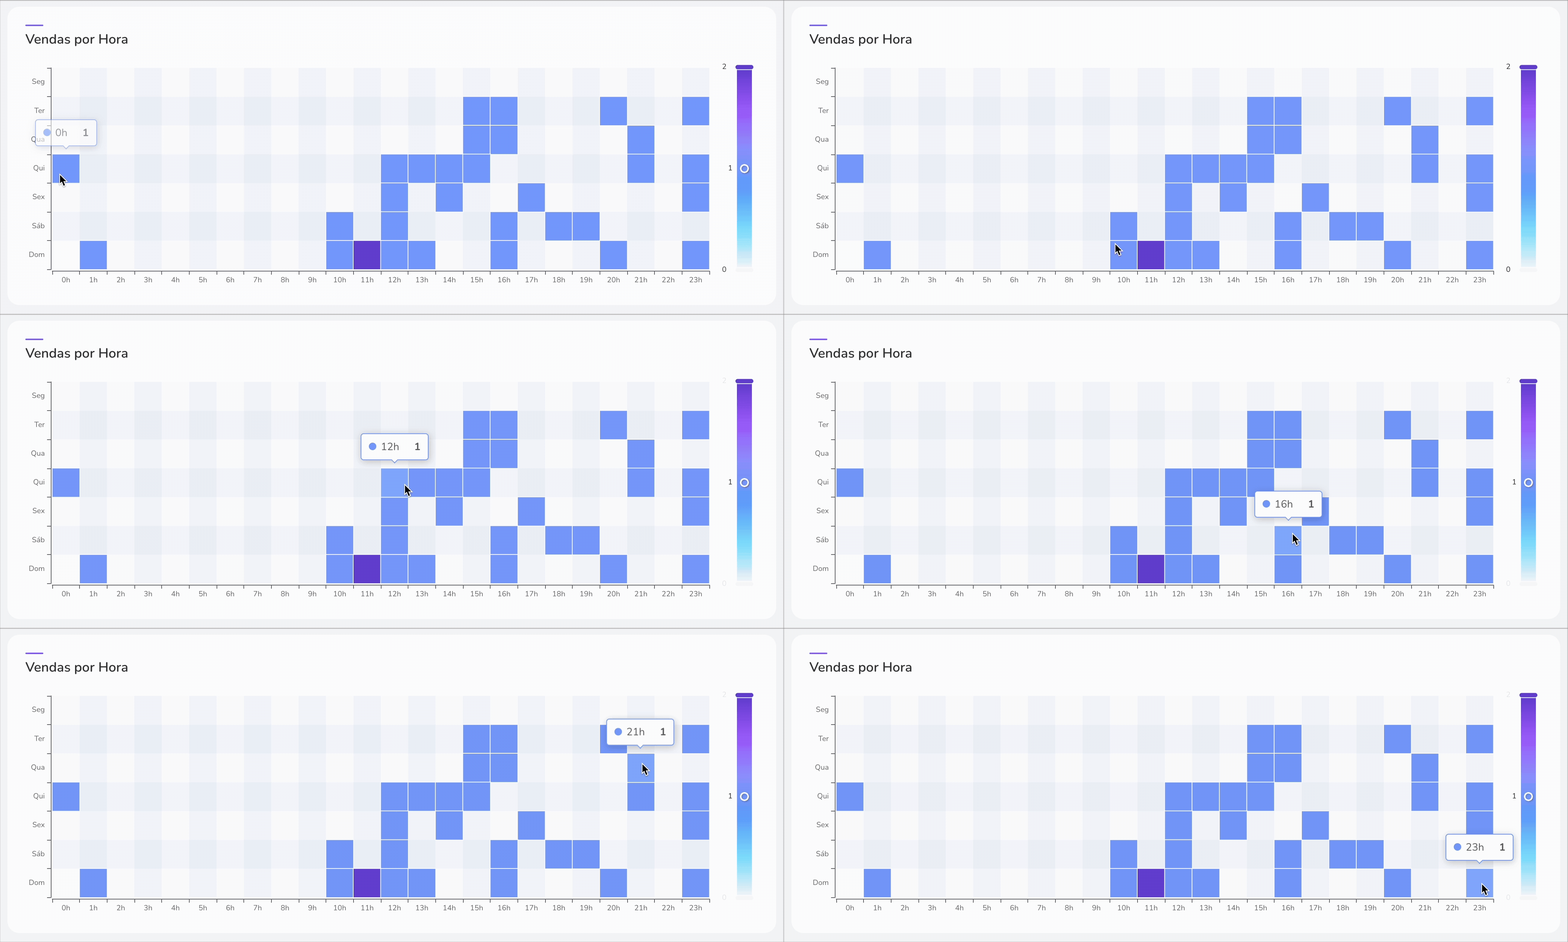
In the Sales per Hour section, a heatmap is presented showing the days and hours of the day when new tracked sales occurred.
Through the chart, it is possible to know the best days and times for new tracked sales.
By default, the presented results consider customers from the last 28 days. In case of filter alteration, only customers who meet the filtering criteria are considered.
Guru's Tip:
To know the volume of new sales for this period, hover the mouse over the square. The darker it is, the higher the volume of new sales.
Sales by Days of the Week
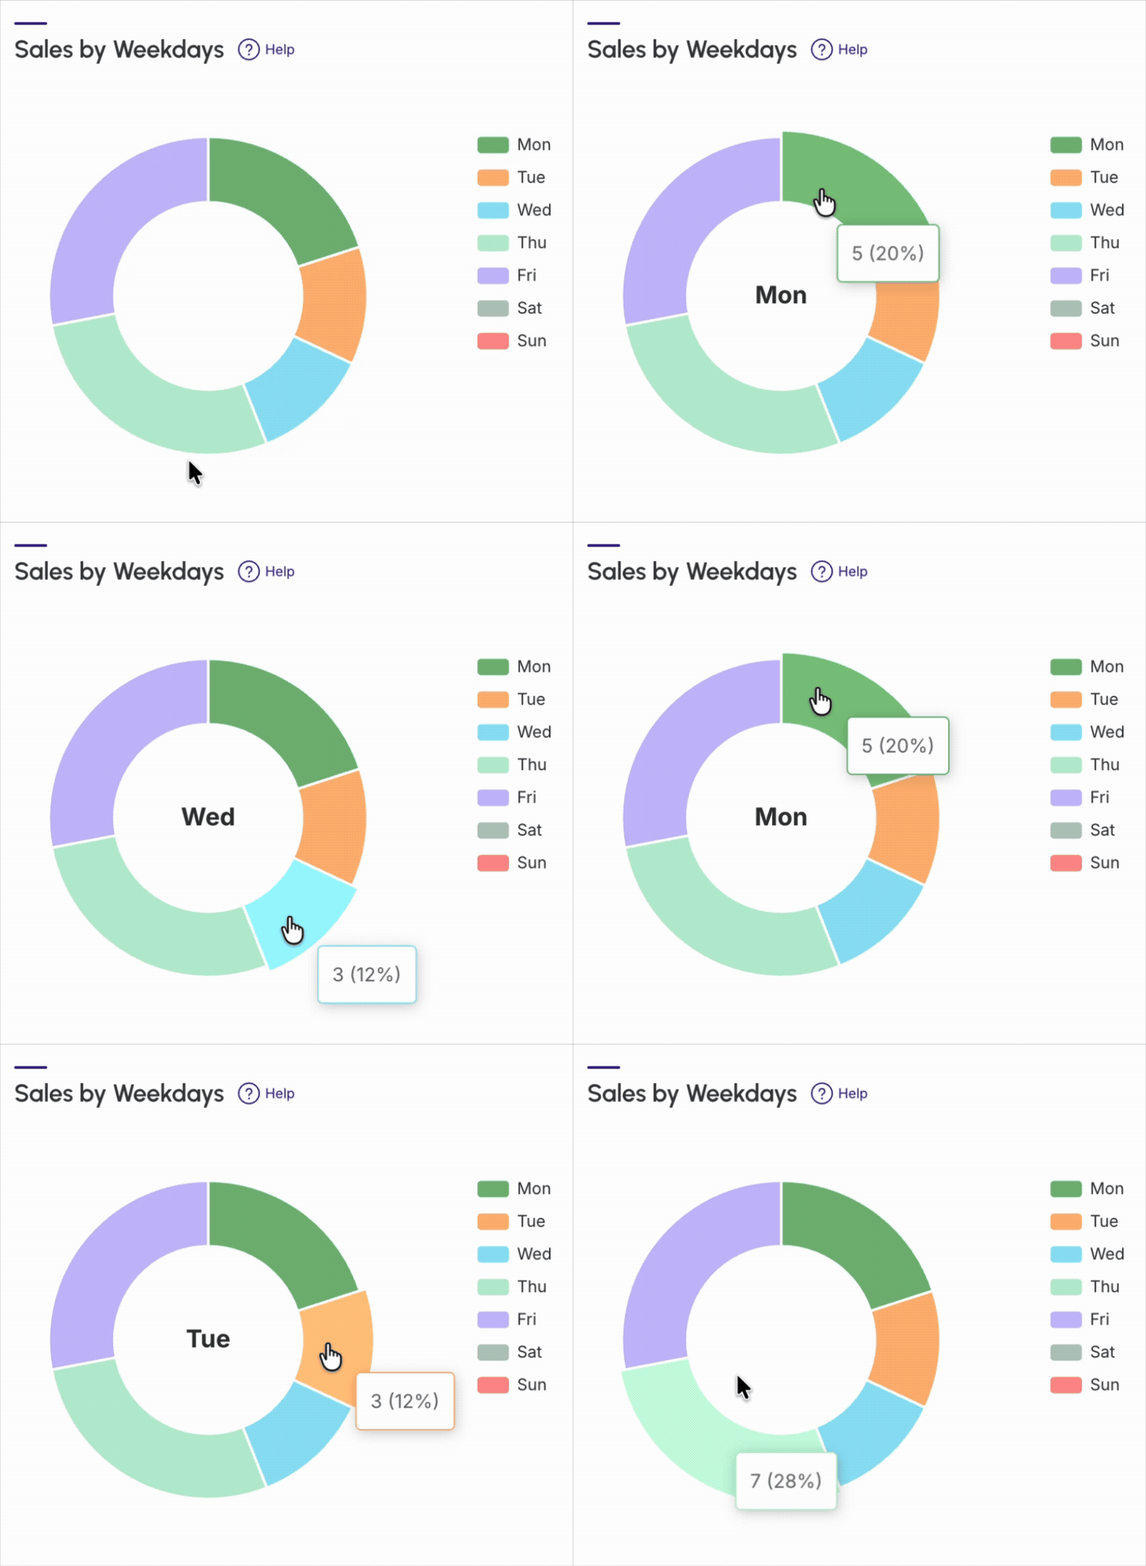
In the Sales by Days of the Week section, it is possible to consult which days of the week generate more tracked sales that converted.
By default, the presented results consider customers from the last 28 days. In case of filter alteration, only customers who meet the filtering criteria are considered.
Guru's Tip:
To know the volume of new sales for this period, hover the mouse over the square. The darker it is, the higher the volume of new sales.
Products
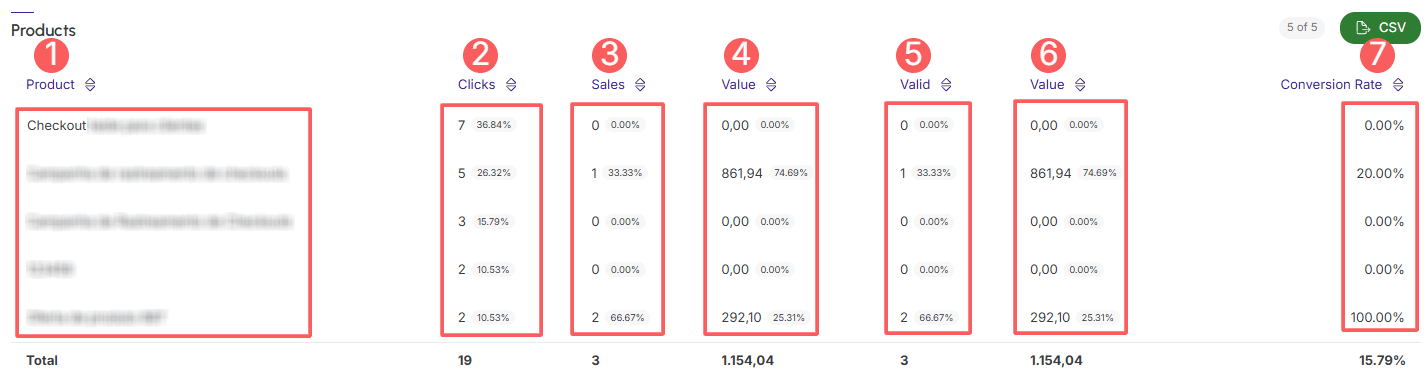
In the Products section, it is possible to observe the ranking of best-selling products, where the top 10 products are represented.
For each product, the following values are displayed:
-
Products: displays the quantity of Products sold(1) in the period;
-
Clicks: displays the number of clicks the product received in the period;
-
Sales: displays the quantity of sales made in the period;
-
Value: displays the total sales value (gross revenue) made in the period;
-
Valid: displays the valid tracked sales in the period;
-
Value: displays the value of completed and made sales in the period;
-
Conversion Rate: displays the conversion rate of tracked and completed sales in the period.
(1) Quantity of Products sold refers to the number of items to be delivered to the customer in the sale. Example: it is possible to make 3 sales of a kit of 4 products, which will be, in total, 12 products.
By default, the presented results consider sales from the last 28 days. In case of filter alteration, only sales that meet the filtering criteria are considered.
Guru's Tip:
You can export the spreadsheet by clicking on the CSV.