
In the Sales Dashboards, metrics, indicators, graphs, and performance analysis of sales results will be presented.
When accessing the dashboard, you view, by default, the results of the last 28 days (4 exact weeks). If you wish, you can analyze other periods by applying a filter.
On this page:
-
General Metrics
-
Daily Sales Volume
-
Sales by Hour
-
Sales by Day of the Week
-
Sales by Status
-
Payment Methods
-
Marketplaces
-
Self-Attribution
-
Conversions by Payment Method
-
Sales by Origin
-
Top Plans
-
Reasons for Refusal
-
Top Affiliates
General Metrics
In the section General Metrics, you can observe the main sales indicators, such as:
-
Revenue: displays the total sum of valid sales (
approvedandcomplete) made during the period; -
Sales: displays the quantity of valid sales (
approvedandcomplete); -
Products(1): displays the quantity of products (items) sold;
-
New Customers(2): displays the number of customers who had an approved sale during the period, of which this is the first sale registered in the account;
-
Refunds: displays the quantity, total value, and percentage of refunded sales.

By default, the presented results consider sales from the last 28 days. In case of filter alteration, only sales that meet the filtering criteria are considered.
(1) Quantity of Products sold refers to the number of items to be delivered to the customer in the sale. Example: if you made 3 sales of a 4-product kit, this corresponds to a total of 12 products.
(2) When applying the filter by specific group or product, the information about New Customers will display new buyers of that product, which is not necessarily a new buyer, meaning a buyer can appear as new multiple times.
Sales Volume
In the section Sales Volume, you can analyze the evolution of sales volume over a period. The information is presented in two ways.
Graph
The graph displays the variation in sales in terms of product quantity, net value, and sales value over a period that can be daily (for periods up to 31 days) or monthly (for periods over 31 days).
Performance indicators
-
Total sales: displays the total value of all sales made during the period;
-
Net total: displays the net total to receive, i.e., deducting affiliate commissions and marketplace fees(1);
-
Net percentage: displays the percentage of the net total of sales made during the period;
-
Products sold(2): displays the number of products sold during the period;
-
Average ticket(3): displays the average value of each sale during the period (total divided by the number of sales);
-
Average profit(4): informs the average profit of sales made during the period, dividing the net total by the number of sales.
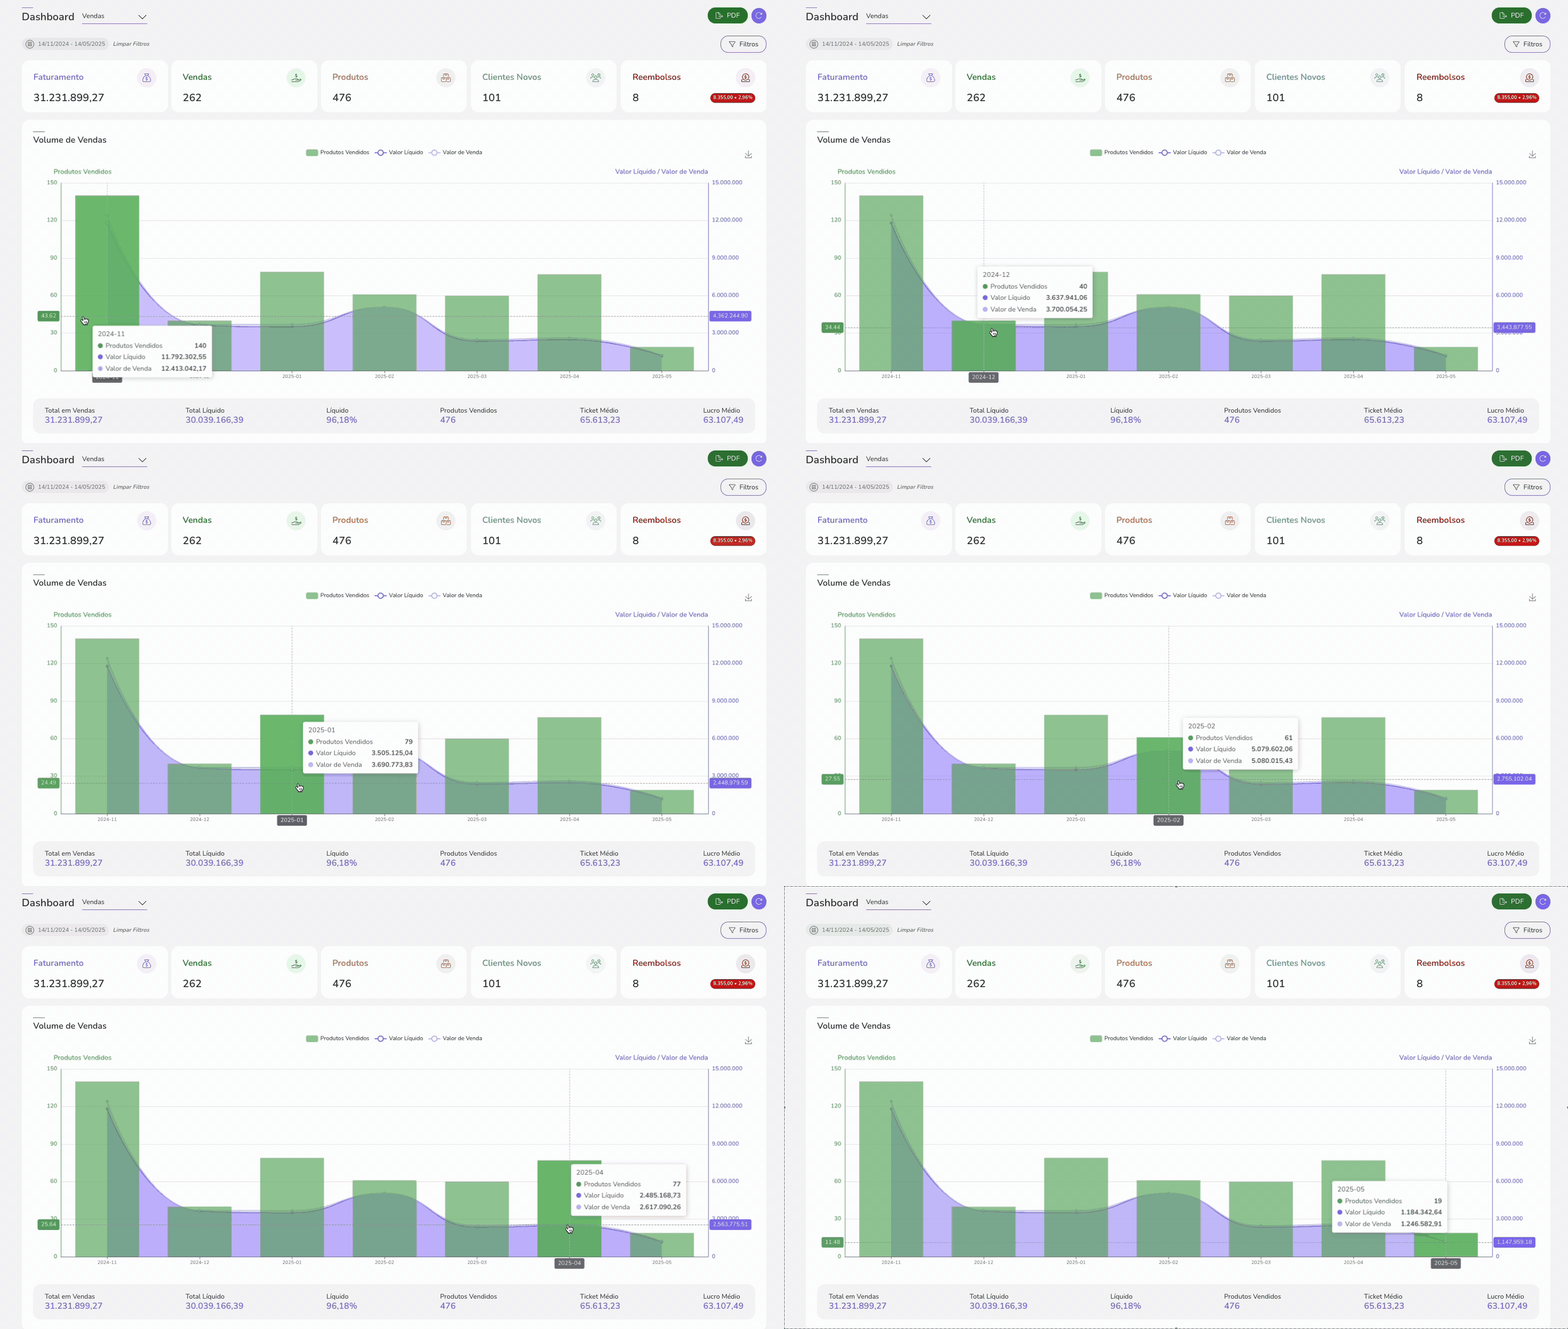
By default, the presented results consider sales from the last 28 days. In case of filter alteration, only sales that meet the filtering criteria are considered.
(1) Considered in the calculation if the marketplace sends this information to Guru. If sent, these fees are also displayed in the sales detail.
(2) Quantity of Products sold refers to the number of items to be delivered to the customer in the sale. Example: it is possible to make 3 sales of a 4-product kit, which will total 12 products.
(3) THE average ticket is the result of dividing total sales by the number of transactions within the selected period.
(4) To calculate the average profit, it is necessary to divide the net total by the number of sales.
Guru's Tip:
If you wish, you can save the graph image: 
Sales by Hour
In the section Sales by Hour a heatmap is presented showing the days and hours of the day when new sales were made.
Through the graph, it is possible to know the best days and times for new sales.
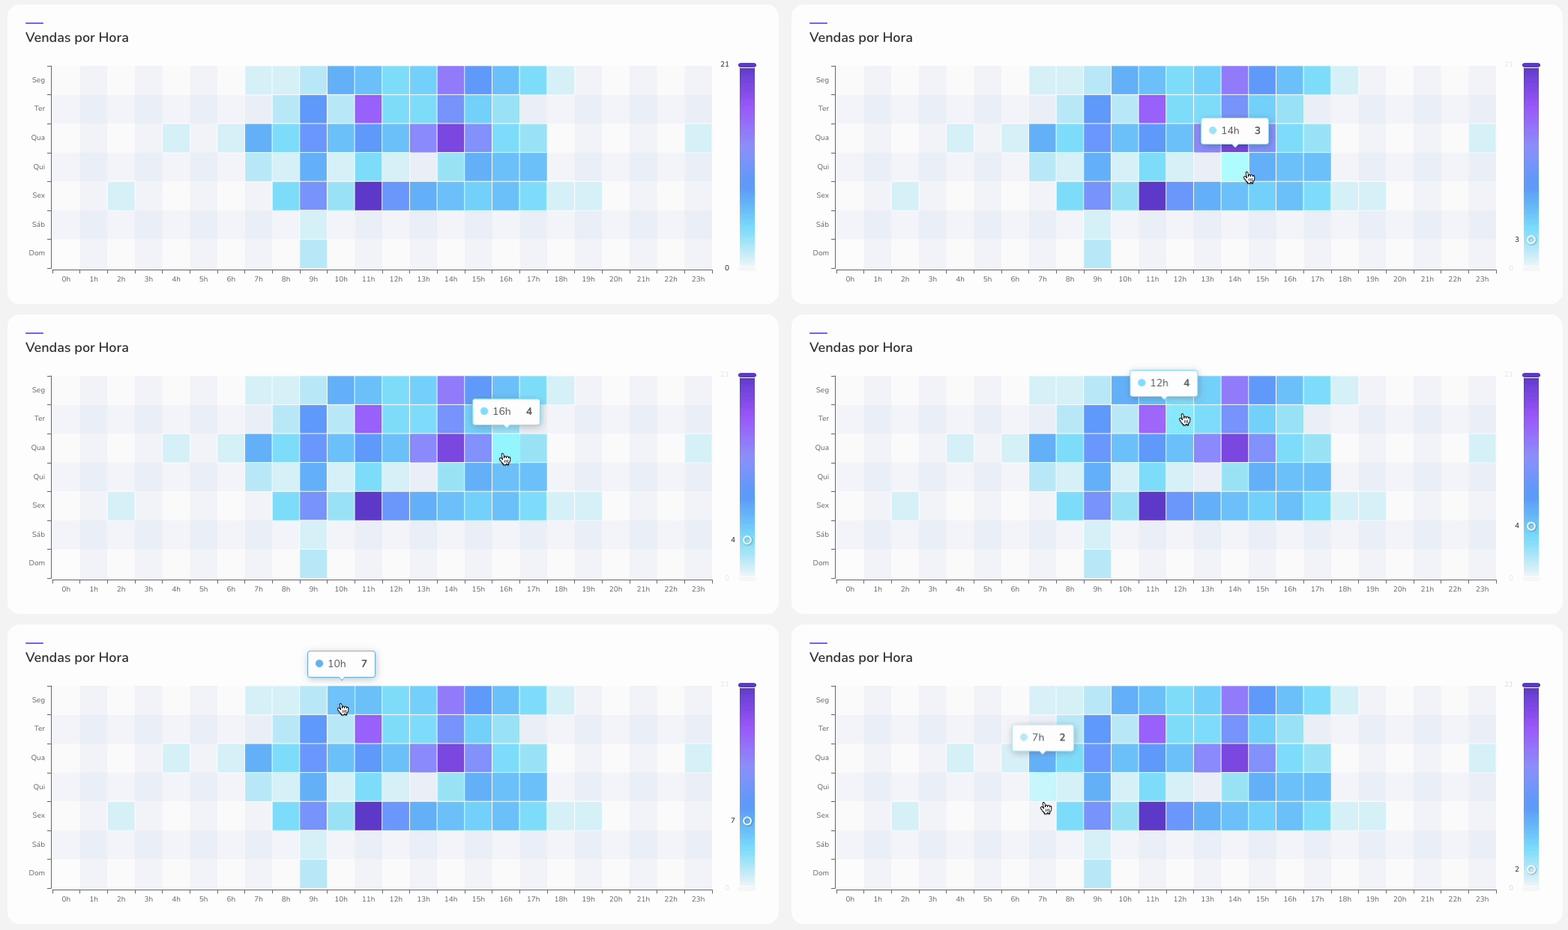
In this graph, subscription renewalsare not accounted for, as these occur at a scheduled time and would generate distortions in the graph.
By default, the presented results consider sales from the last 28 days. In case of filter alteration, only sales that meet the filtering criteria are considered.
Guru's Tip: To know the volume of new sales for this period, hover your mouse over the square. The darker it is, the higher the volume of new sales.
Sales by Weekdays
In the section Sales by Weekdays, you can consult which days of the week generate the most sales.
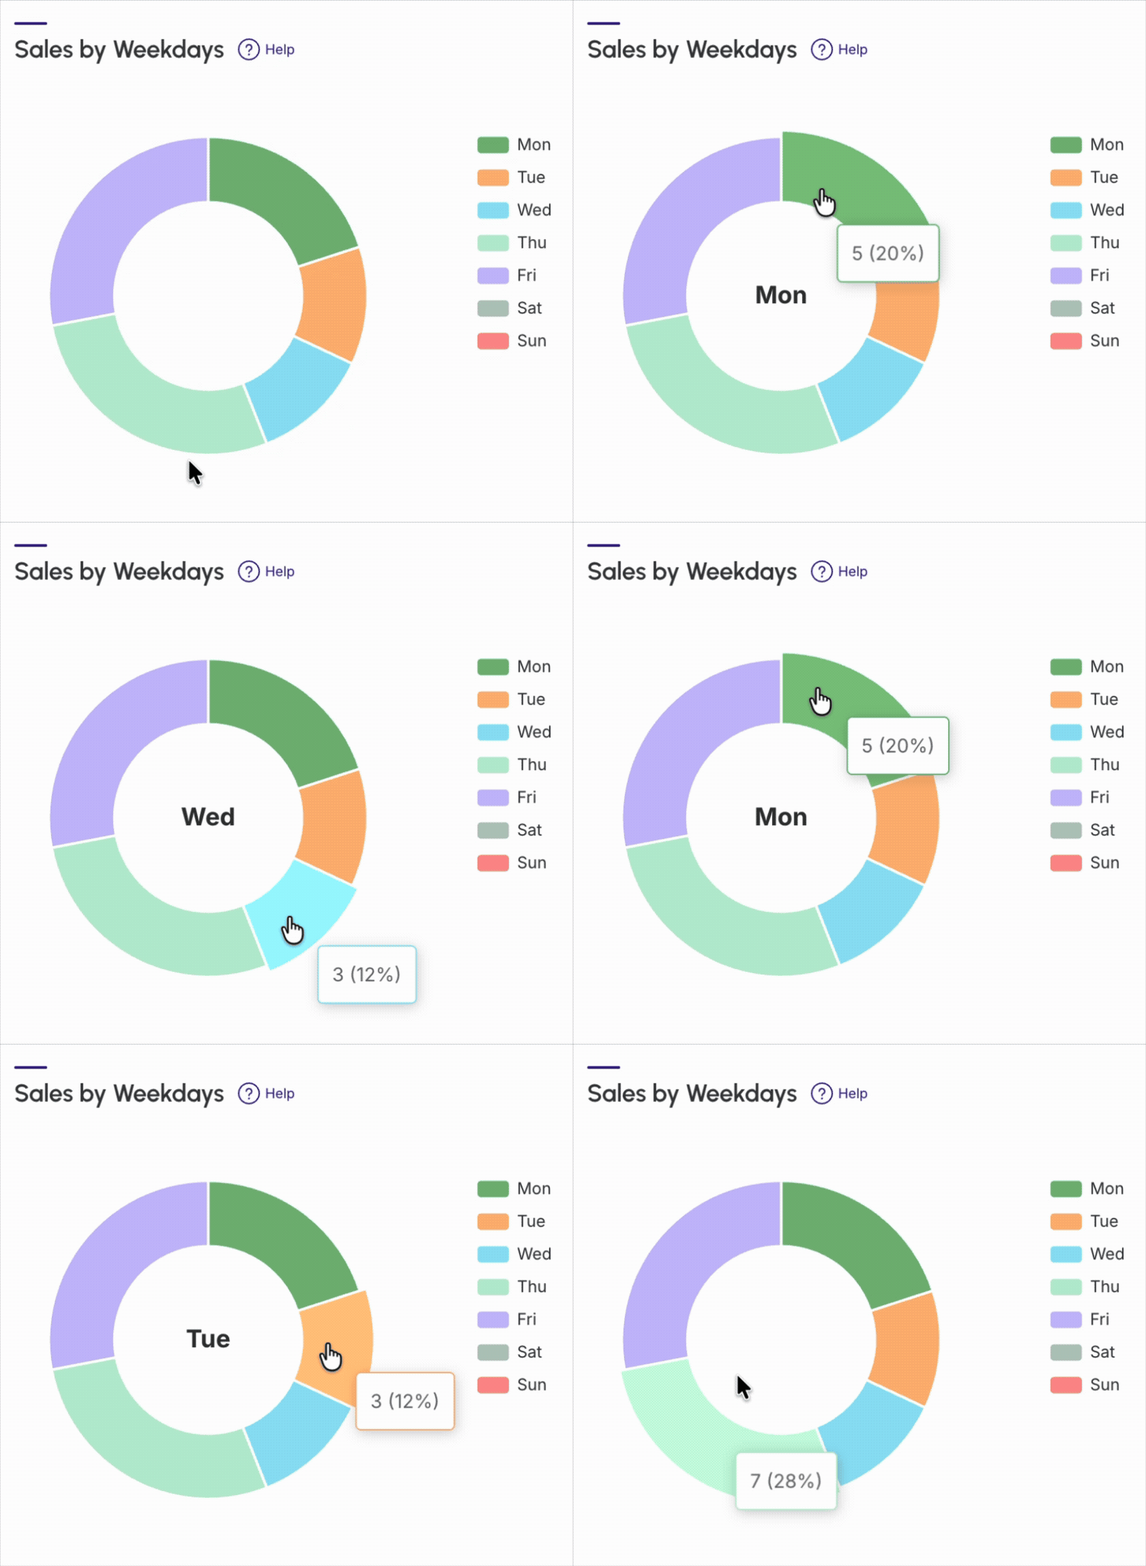
In this graph, subscription renewals are not accounted for, as these occur at a scheduled time and would generate distortions in the graph.
By default, the presented results consider sales from the last 28 days. In case of filter alteration, only sales that meet the filtering criteria are considered.
Guru's Tip: To know the volume of new sales for this period, hover your mouse over the square. The darker it is, the higher the volume of new sales.
Sales by Status
In the section Sales by status, the graph represents the proportion of sales made by transaction status: approved, canceled, expired, refunded, claimed, pending payment and printed boleto.
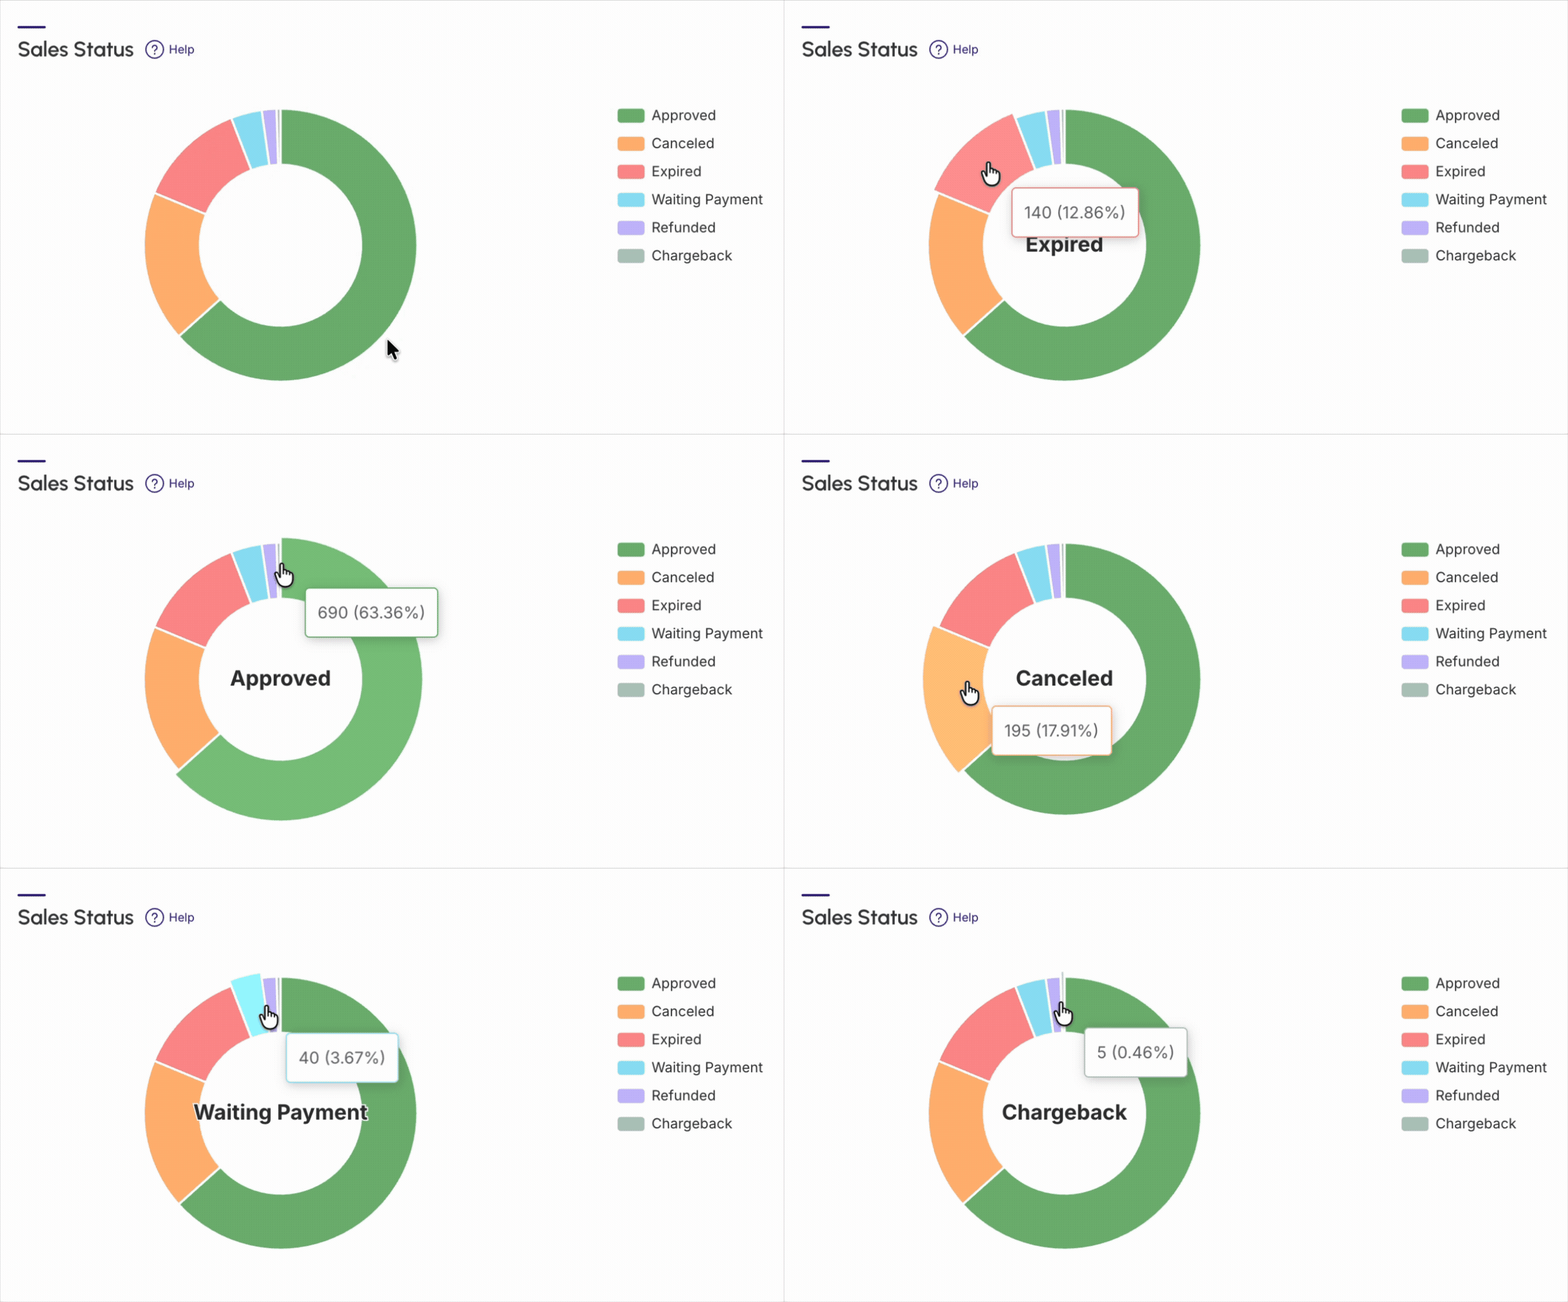
Actions that can be taken based on metrics
-
Based on the percentage of sales that did not complete due to lack of payment, it is possible to activate integration with autoresponder, you can also activate and customize the sending of transactional emails or a sales recovery tool, to create a remarketing campaign with the goal of increasing your conversion rate;
-
Based on the percentage of sales that had a refund requested, you can use this indicator to analyze the reason for so many refunds and re-evaluate/revise your operation/business, to reduce this percentage.
By default, the presented results consider sales from the last 28 days. In case of filter alteration, only sales that meet the filtering criteria are considered.
Guru's Tip: You can check the percentage of each status by clicking on the title.
Payment Methods
In the section Payment methods, the graph represents the proportion of sales made by payment type: credit card, multibanco, bank slip, direct debit, Paypal, trial (free), among others.
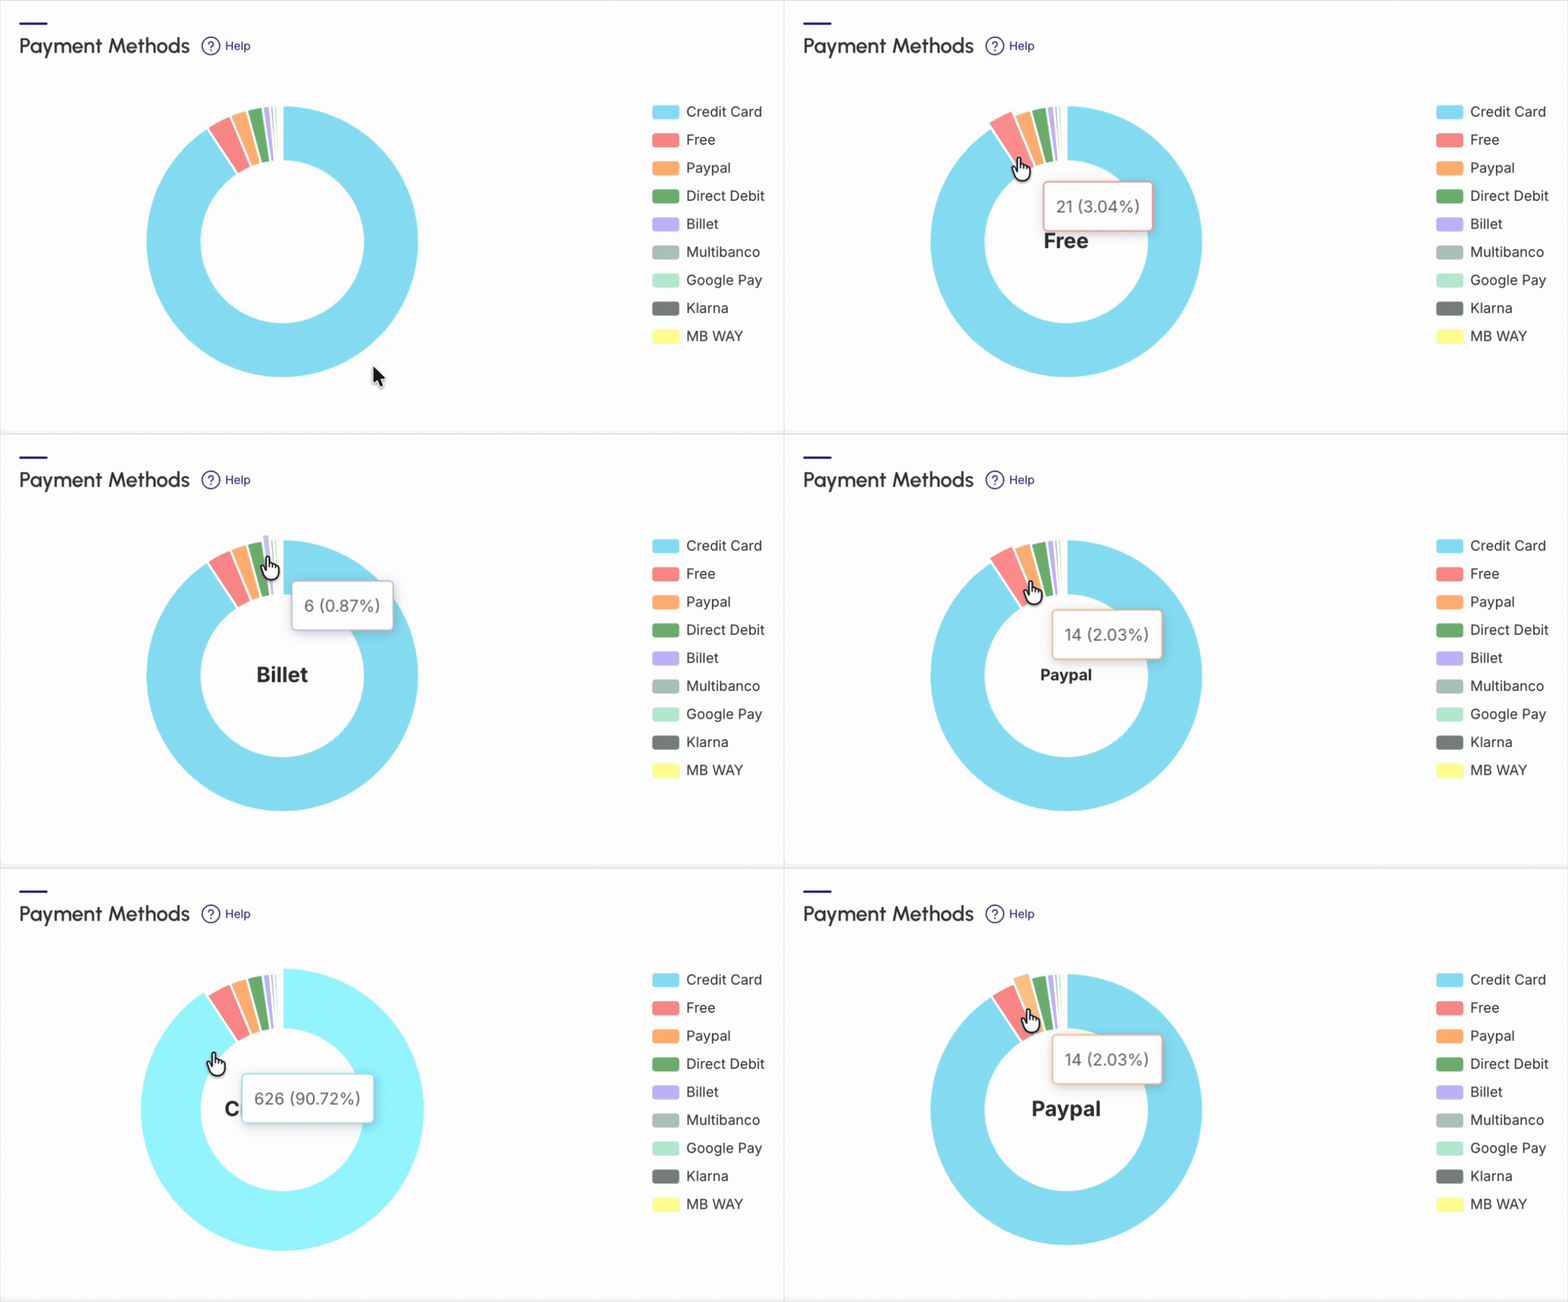
Actions that can be taken based on metrics
-
Sales Recovery: you can send sales with pending payment (e.g., bank slip, Pix, or Multibanco) to autoresponder or sales recovery tools and take action to close open orders;
-
Offer new payment methods: if you conclude that there are many abandoned sales, uncompleted payments, or many sales rejected due to insufficient card balance, consider offering other payment methods. You can do this by integrating one or more processors in the virtual wallet category.
By default, the presented results consider sales from the last 28 days. In case of filter alteration, only sales that meet the filtering criteria are considered.
Guru's Tip: You can check the percentage of each status by clicking on the title.
Marketplaces
In the section Marketplaces, the graph represents the proportion of sales made in each marketplace (payment processor).
The data from this graph can be used to boost your results. For example:
-
prioritize distributing among payment processors to generate more revenue for you;
-
configure the results of a/B tests that divide checkout traffic among different marketplaces, realizing which one has a higher conversion rate.
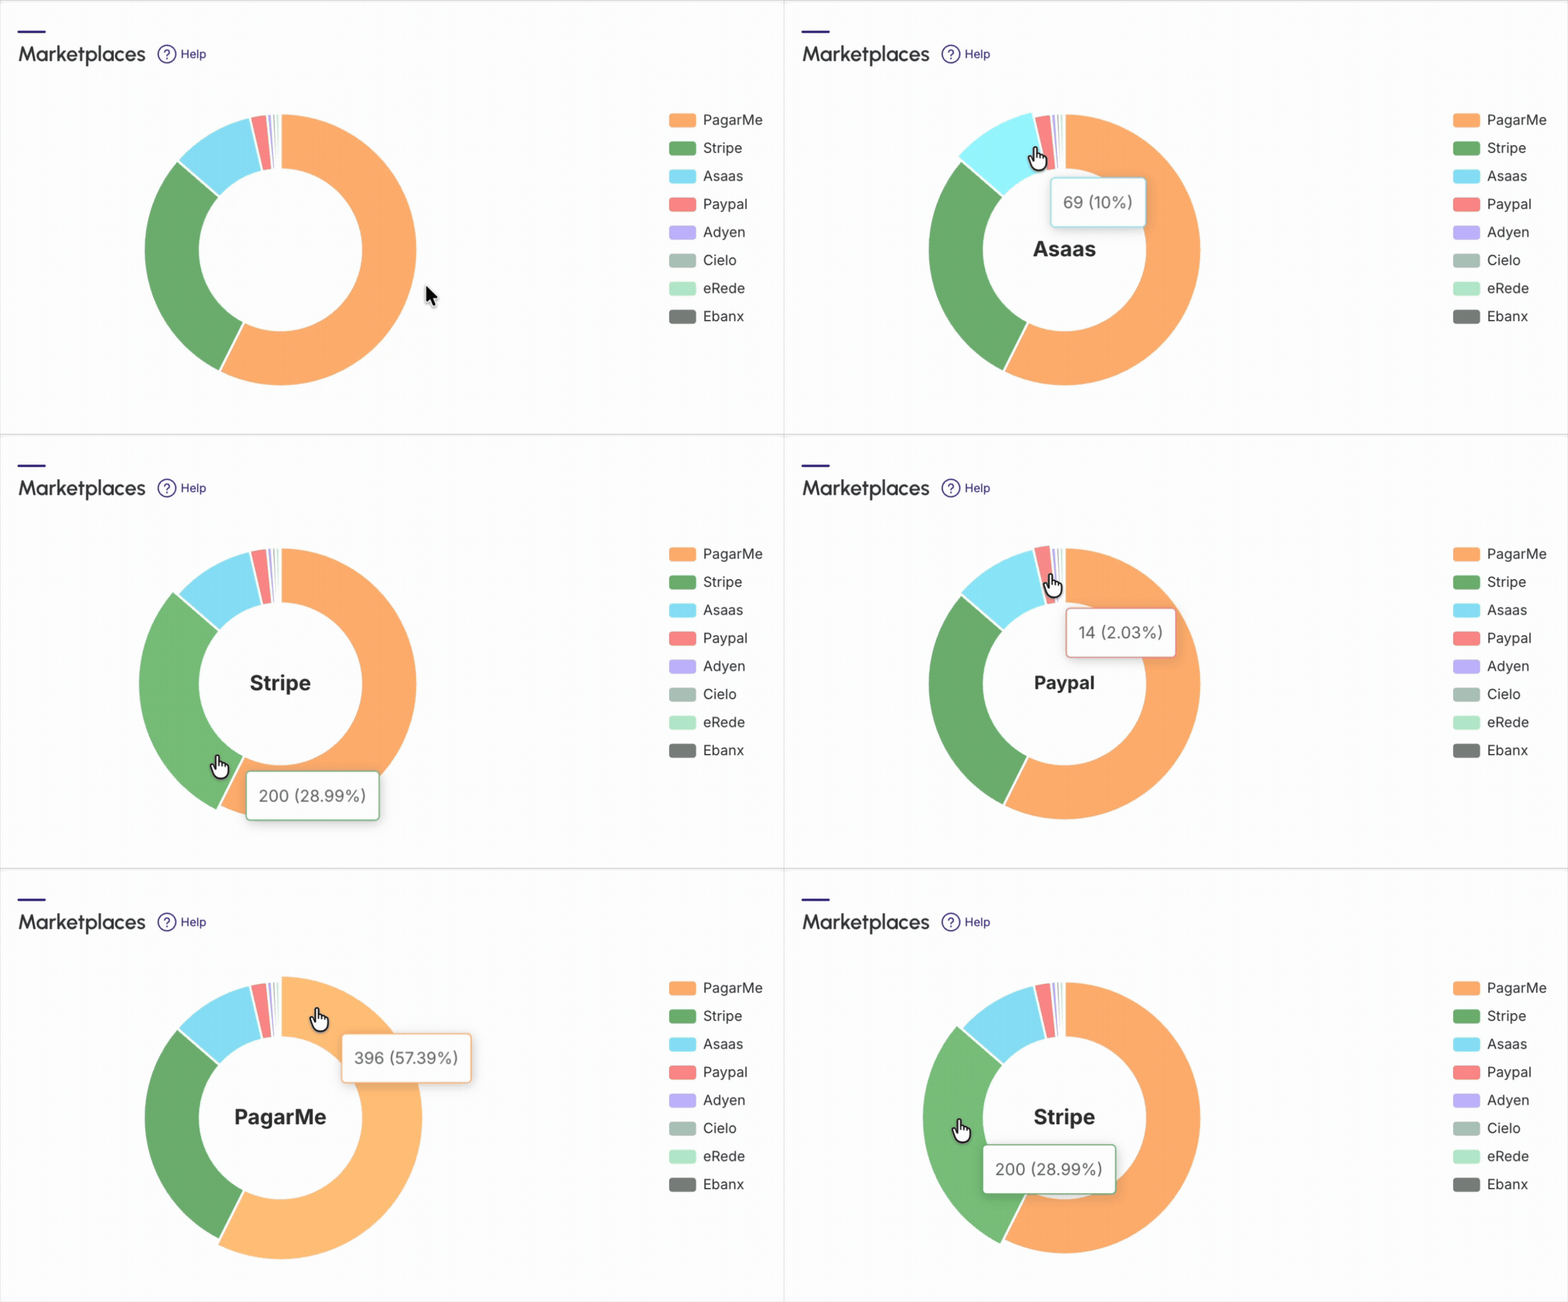
By default, the presented results consider sales from the last 28 days. In case of filter alteration, only sales that meet the filtering criteria are considered.
Guru's Tip: You can check the percentage of each status by clicking on the title.
Self-Attribution
In the section Self-Attribution, you can analyze information about the origin of how your customers learned about your product or service, as reported by them.
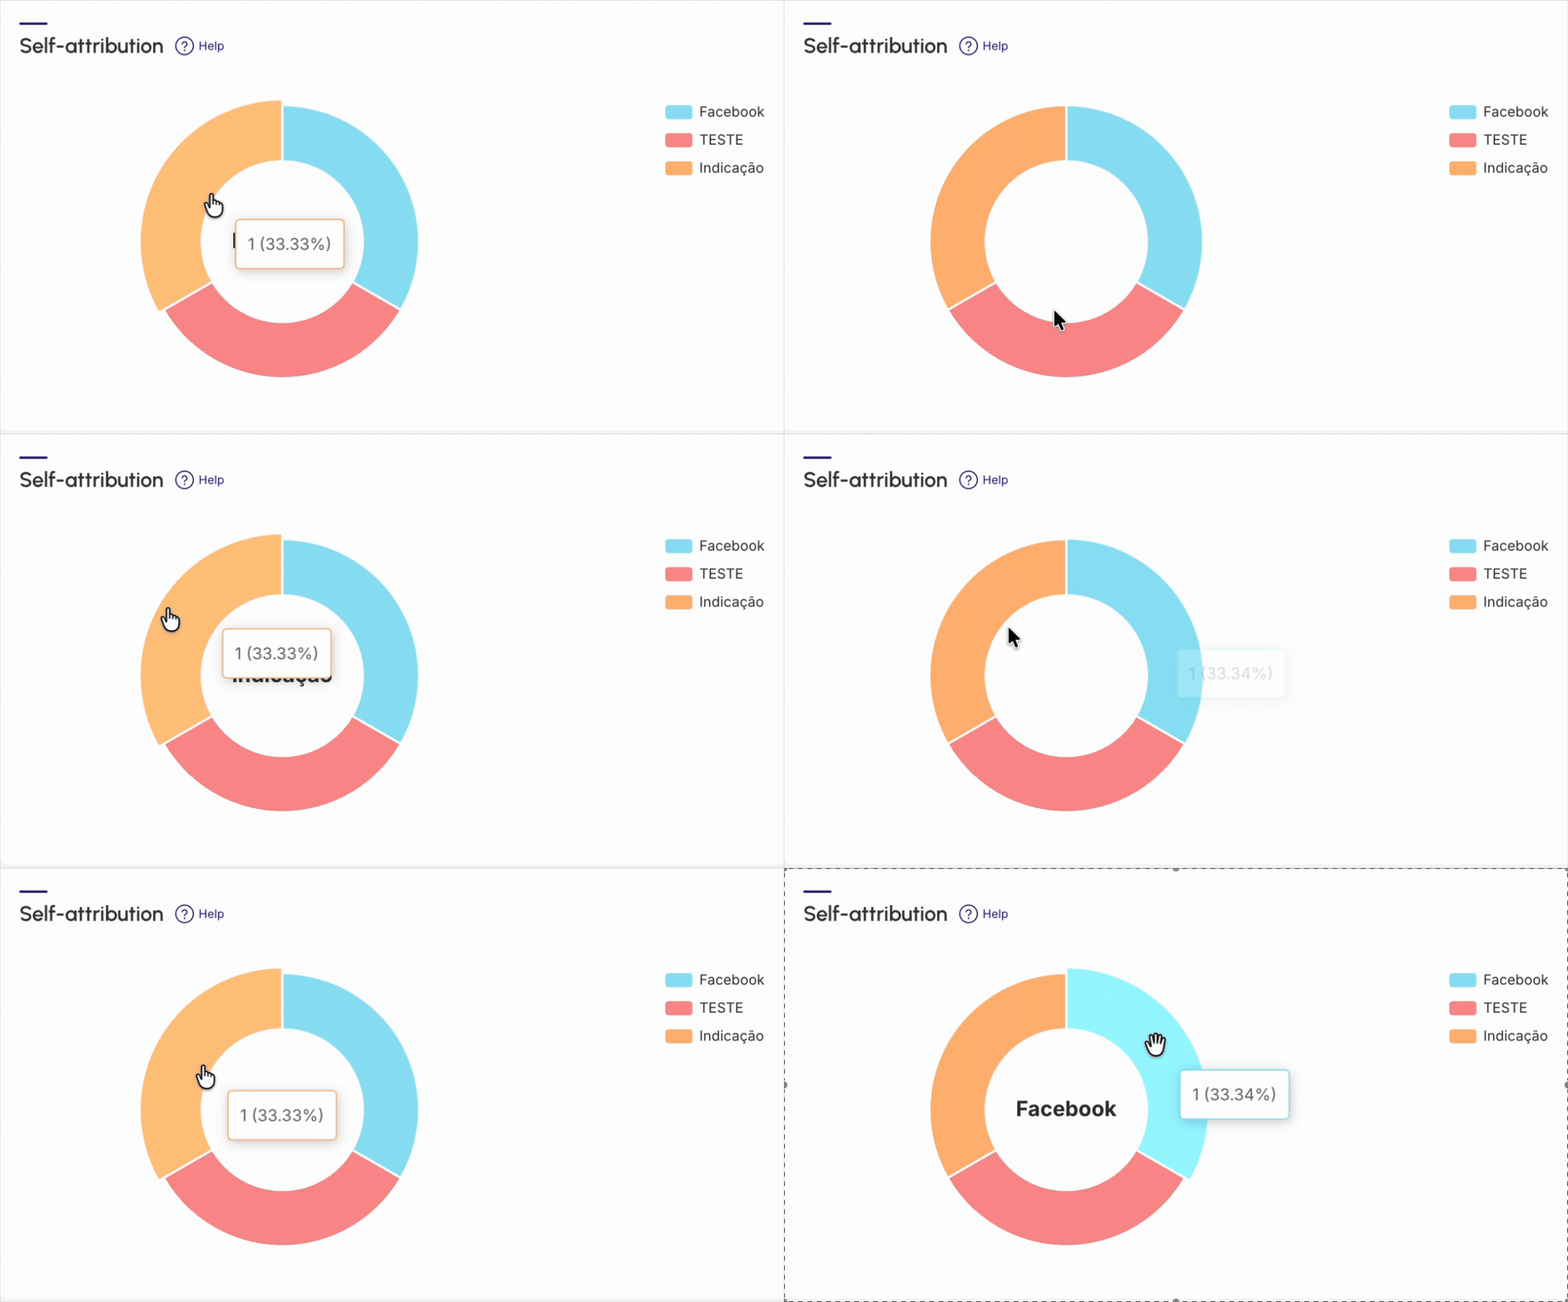
Based on the informed data, you can take some actions such as
-
Marketing budget optimization: by identifying the channels that bring in the most customers, you can direct your investment to sources with higher returns - if Google Search, for example, is the main channel, it makes sense to invest more in SEO and ad campaigns - you can send conversion and customer origin data with ad tools to create and adjust your campaigns;
-
Campaign personalization: understanding a customer's origin allows for creating more targeted marketing messages.
-
For example, customers who came from Google Search may be actively looking for a solution, so a campaign with a direct call-to-action may be more effective, or
-
Customers who came directly from the website, campaigns with exclusive offers can encourage them - you can send information about the origin of each customer using an email marketing tool to automate content or campaign dispatches;
-
-
Improved customer experience: knowing the customer's journey from the beginning helps improve the overall experience. If most customers find your business through an ad, ensuring that the landing page is relevant and easy to use is crucial to converting them into sales.
By default, the presented results consider sales from the last 28 days. In case of filter alteration, only sales that meet the filtering criteria are considered.
Guru's Tip: You can check the percentage of each status by clicking on the title.
Approval by payment method
In the section Approval by payment method , it is possible to consult the percentage and number of valid sales (payment confirmed) for each payment method used.
-
Revenue(1): total sales from payment methods;
-
Credit Card(1): percentage of sales approved for credit.

(1) The integer on the left equals approved sales, and the number on the right is the total number of sales.
In this graph, subscription renewals are not accounted for, as these occur at a scheduled time and would generate distortions in the graph.
By default, the presented results consider sales from the last 28 days. In case of filter alteration, only sales that meet the filtering criteria are considered.
Sales by Source
In the section Sales by source, it is possible to consult the sales ranking grouped by traffic origin, which is informed in the tracking link when P.P.C.T.s are created.
For each product, sales metrics are displayed, such as:
-
Source: displays the source of sales(1);
-
Sales: displays the quantity of sales(2);
-
Products: displays the quantity of products sold;
-
Sales Total: displays the total sales value (gross revenue);
-
Affiliates Total: displays the total commission value paid to Affiliates;
-
Total Net Value: displays the net total value to receive (after deducting all expenses/comissions);
-
Net Value: displays the percentage of the net total to receive.

(1) To know the origin of sales, it will be necessary to have trackings created. If there are no active trackings, the origin will report “no trackings”.
(2) Quantity of Products sold refers to the number of items to be delivered to the customer in the sale. Example: it is possible to make 3 sales of a kit of 4 products, which will be a total of 12 products.
By default, the results presented consider sales from the last 28 days. In case of filter alteration, only sales that meet the filtering criteria are considered.
Guru's Tip: You can export the spreadsheet by clicking on the CSV.
Top Plans
In the Top Plans section, it is possible to observe the ranking of best-selling products, where the top 10 products are represented.
For each product, the following values are displayed:
-
Name: displays the product name;
-
Sales: displays the quantity of sales;
-
Products: displays the quantity of products sold(1);
-
Sales Total: displays the total sales value (gross revenue);
-
Affiliates Total: displays the total commission paid to affiliates;
-
Total Net Value: displays the total net value to be received (after deducting all expenses/commissions);
-
Net Value: displays the percentage of the total net value to be received.

(1) Quantity of Products sold refers to the number of items to be delivered to the customer in the sale. Example: it is possible to make 3 sales of a kit of 4 products, which will be a total of 12 products.
Actions that can be taken from the metrics
The data from this ranking can be used to know which products are responsible for your largest share of revenue. For example:
-
Invest more marketing budget in products that yield more results, understanding which products generate more sales for your business and where you can further increase your profitability.
By default, the results presented consider sales from the last 28 days. In case of filter alteration, only sales that meet the filtering criteria are considered.
Guru's Tip: You can export the spreadsheet by clicking on the CSV.
Refuse Reasons
In the Refuse Reasons section, it is possible to consult the reasons for sales refusal (returned by the payment processor), the quantity and percentage of sales refused for the same reason.
For each product, the refusal reasons are displayed, such as:
-
Reason: reason for refusal informed by the payment processor;
-
Sales: number of sales with the previous refusal reason;
-
Percentage: displays the percentage of total refused sales.

By default, the results presented consider sales from the last 28 days. In case of filter alteration, only sales that meet the filtering criteria are considered.
Guru's Tip: You can export the spreadsheet by clicking on the CSV.
Top Affiliates
In the Top Affiliates section, it is possible to observe the ranking of the top 10 affiliates who made the most sales(1) and know which affiliates are responsible for your largest share of generated revenue.
For each top affiliate, the following topics are displayed:
-
Name: displays the affiliate's name;
-
Product: displays the product sold;
-
Sales: displays the number of sales;
-
Products: displays the number of products sold(2);
-
Total Sales: displays the total value of all sales (gross revenue);
-
Total Commissions: displays the total commission value paid to the affiliate;
-
Commission: displays the percentage of the total net amount paid to the affiliate.

(1) THE ranking is based on sales with “approved” and “complete” status.
(2) Quantity of Products sold refers to the number of items to be delivered to the customer in the sale. Example: it is possible to make 3 sales of a kit of 4 products, which will be a total of 12 products.
Actions that can be taken from the metrics
Based on the Top Affiliates list, you can:
-
Strengthen relationships with top players helping them further increase their sales and, possibly, expand the partnership to their other products;
-
Know which affiliates to train with the aim of addressing the main doubts and needs of affiliates during promotional activities, serving as support to achieve better results;
-
Monitor affiliate performance and take quick actions to help them regain their position in the performance ranking when sales drop.
By default, the results presented consider sales from the last 28 days. In case of filter alteration, only sales that meet the filtering criteria are considered.
Guru's Tip: You can export the spreadsheet by clicking on the CSV.
More Resources