
Find answers to frequently asked questions and situations related to the Customer Dashboard from Guru. This panel is your strategic tool to get an overview of the revenue generated by your customers and analyze the recurrence of your base.
Through automatically updated indicators, graphs, and performance metrics, you can perform crucial analyses for the growth of your business.
On this page:
-
Customer data management
-
Customer base analysis
-
Customer base profitability
-
Average ticket per customer
-
Buyer base dynamics
-
Origin of accesses
-
Payment preferences and settings
Customer data management
In this section, you will find guidelines on how to filter and export the information displayed on the Customer Dashboard. This way, you can adjust the data according to the desired period and use features that facilitate the analysis of your customer base.
- How can I filter Customer Dashboard data?
You can filter Customer Dashboard information using the Period field - this way you can adjust the start and end dates of the analysis according to your needs.
By default, the Customer Dashboard shows the results of the last 28 days (4 weeks). The consolidated metrics in this interval are calculated automatically. To analyze a different period, you can filter the dashboard by period, using predefined intervals or selecting the date you wish to view.
Thus, you can analyze anything from a specific subset of customers to longer periods to track trends and the evolution of your base.
- How can I export Customer Dashboard data?
To export Customer Dashboard data, access the side menu in the Guru admin, click on Dashboards and, in Customer Dashboard, click on PDF at the top of the page. After a few minutes, the PDF Download will appear for Saving.
If you wish to export your dashboard data, access Manage Customer Dashboards.
Customer base analysis
In the Indicators section, you view current, active, new, and old customers, thus gaining an overview that allows for better analysis of your base. This data provides a quick insight into customer purchasing behavior within the analyzed period, allowing you to analyze the activity of your customer base.
- What data is displayed in the Indicators section?
The Indicators section displays a summary of the main numbers related to customers in the selected period on the dashboard. Here, you can view the number of current, active, new, and old customers.

To access more information about the types of customers displayed, go to the Indicators section in Metrics displayed on the Customer Dashboard.
- What is the difference between active customers and current customers?
To interpret the indicators in the best way, it is important to know what each metric represents. See the difference between active customers and current customers:
-
Active customers: displays the total number of buyers who made at least one purchase in the period filtered on the dashboard;
-
Current customers: displays all customers in the account, i.e., who made at least one purchase - if you want to find the information, apply the filter type "customer" in the contacts tab.
This means that active customers represent the sum of new customers + old customers.
This distinction helps you understand your customer base and compare the history of buyers with those generating sales in the analyzed period.
- Which sales are considered in the indicators?
The Customer Dashboard only considers completed sales to calculate all indicators displayed in the analyzed period.
By default, the results of the last 28 days are analyzed, displaying metrics based on customers who made purchases within that interval. To analyze a different period, you can filter the dashboard by period, using predefined periods or selecting the date you wish to view.
When adjusting the period filter, the dashboard automatically recalculates the metrics displayed, considering only completed sales and customers belonging to the selected interval.
Customer base profitability
In this section, you can clarify your doubts about how to interpret the Customer Lifetime Value (LTV) Evolution graph, which shows the variation of the average revenue generated by each customer over time.
- What is Customer Lifetime Value (LTV) and how is it calculated?
Customer Lifetime Value (LTV) represents the average total revenue generated by each customer throughout their relationship with the business. It shows how much, on average, each customer contributes in sales within the analyzed period.
The LTV calculation is based on the total approved sales divided by the number of customers considered in the interval. This metric helps evaluate base behavior and the impact of recurrence on revenue.
On the Customer Dashboard, in addition to the Customer Lifetime Value Evolution section, LTV also appears in the Customers section, which displays the lifetime value and average sales per customer in the selected period.
- Which purchases are considered in the Customer Lifetime Value Evolution graph?
The Customer Lifetime Value Evolution graph represents the evolution of the average revenue generated by each customer within your business, using the following performance indicators: old customers, new customers and customer lifetime value.
Approved sales in the selected period are considered – they make up the revenue used to calculate how much, on average, each customer generated for the business over time.
The main rules are:
-
Only approved sales: only completed transactions are included in the calculation - refunds and chargebacks are deducted from revenue;
-
Analyzed period: by default, the dashboard displays the last 28 days, but the interval can be changed using the period filter;
-
Customers considered: the calculation only takes into account customers who meet the criteria defined in the period filter.
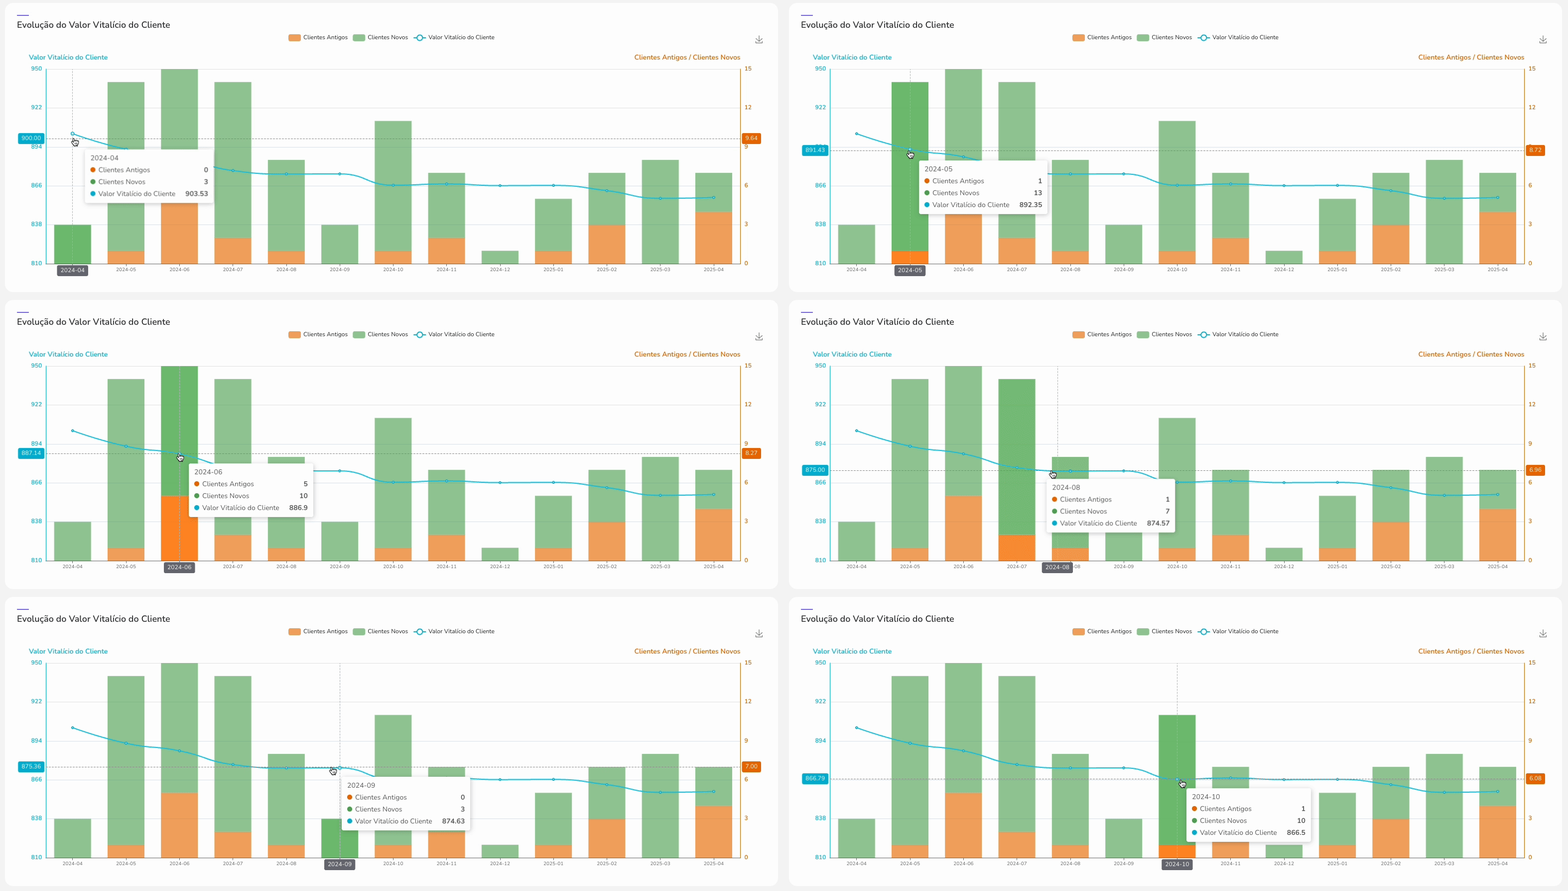
Thus, the graph shows the evolution of LTV based on the total net revenue generated by customers within the filtered interval.
Average ticket per customer
In this section, you will find information on how the average ticket per customer is calculated and displayed on the dashboard.
- How is the average ticket calculated?
The average ticket represents the average value each customer generated in purchases within the selected period* on the Customer Dashboard.
How it works in practice
The calculation is made by dividing the total approved sales by the number of active customers in the period, as in the example below:
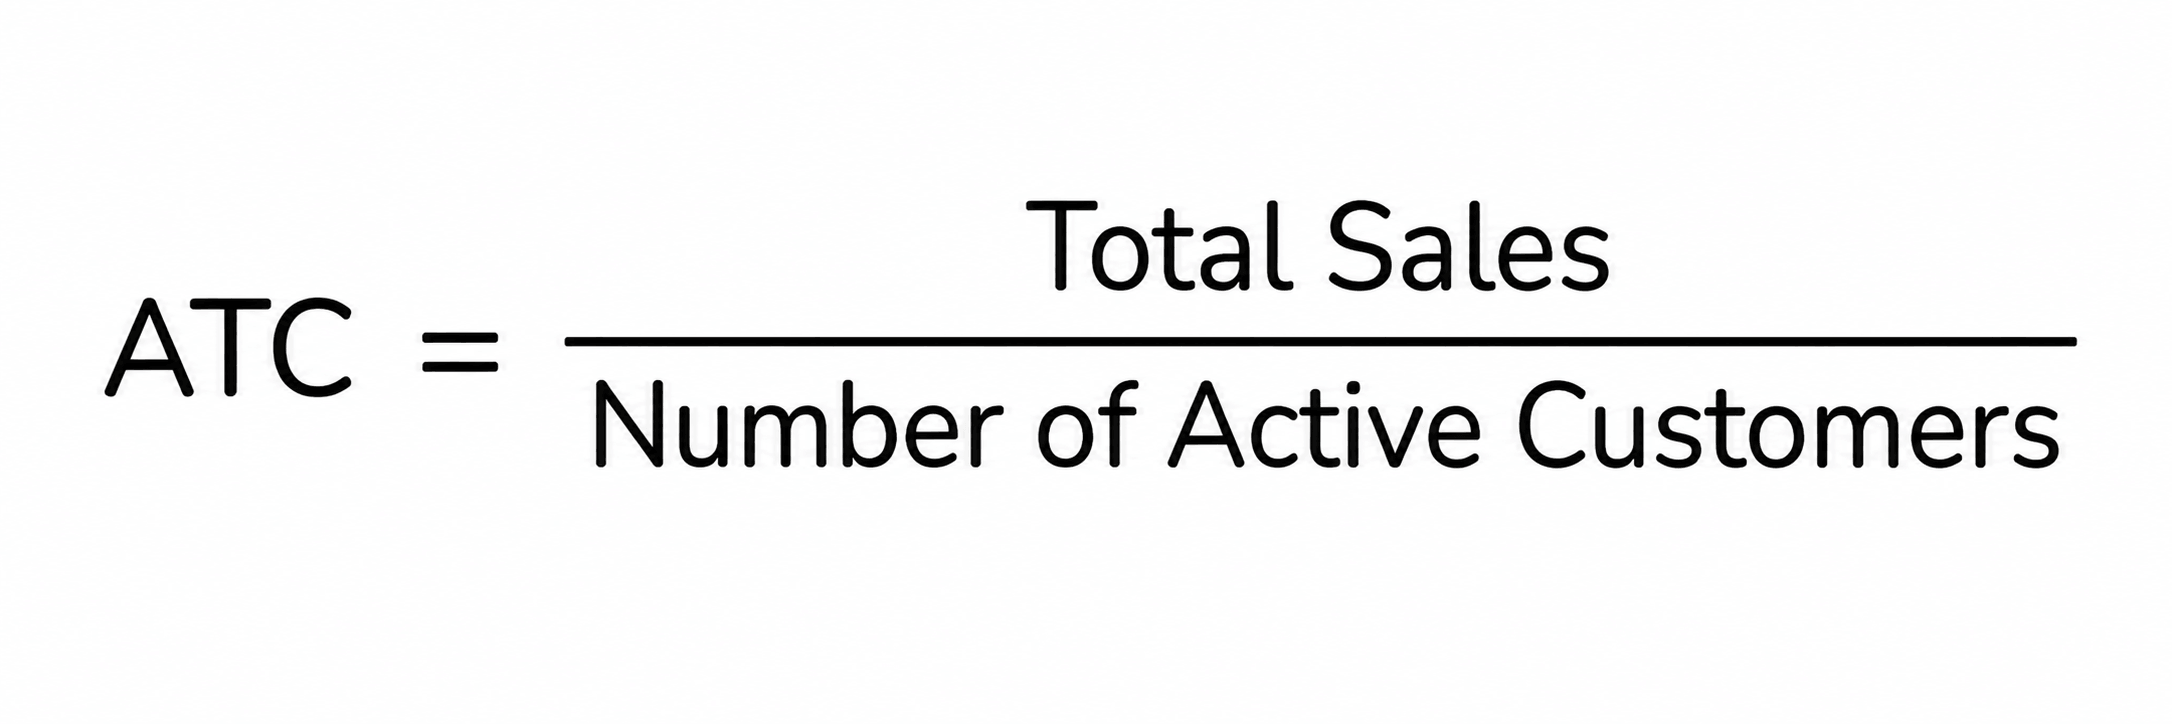
That is:
-
ATC: the Average Ticket per Customer refers to the value to be calculated; while the
-
Total Sales: means the total sales revenue in a specific period - such as month, quarter, year; and the
-
Number of Active Customers: is the number of unique customers who made at least one purchase in that same period.
*By default, the Customer Dashboard displays the last 28 days, but the interval can be changed in the Periodfilter, using predefined intervals or adjusting the dates as desired.
By default, the Customer Dashboard displays metrics for the last 28 days. To analyze a specific period, you can filter the dashboard, using predefined periods or selecting the date you wish to view.
- Does the average ticket consider all registered customers?
No. The average ticket only considers customers who made purchases within the selected period. Registered customers who did not make any purchases in the analyzed interval are not included in the calculation.
Buyer base dynamics (Customers)
In the Customers section, you learn how to identify the types of customers displayed on the dashboard and how to interpret the metrics related to your base, such as active, current, new, and old customers.
- How does the Dashboard identify if a customer is new or old?
Customer classification is done automatically based on the complete purchase history recorded in the account. This verification depends on the applied filter and the customer's history.
-
New customers: is the customer who makes their first purchase in the account, regardless of the filtered period;
-
Old customers: is the customer who has already made at least one previous purchase at any time and returns to buy within the analyzed period.
it is possible to filter the dashboard to view a smaller subset of customers. To do this, in the Guru admin, go to Dashboards and, in Customers, click on Filters. In this field, you can adjust the period you wish to view, using predefined intervals or selecting the desired date.
To access more information about the types of customers, go to the Indicators section in Metrics displayed on the Customer Dashboard.
- Why might the number of current customers be different from the sum of new and old customers?
The sum of new + old customers is represented by the active customers value, which displays all customers who made at least one purchase in the period applied in the filter.
Current customers, on the other hand, represent all customers who made at least one purchase, regardless of the period.
In some cases, there may be adjustments due to applied filters or specific dates that impact each metric individually.
It is possible to filter the dashboard to view a smaller subset of customers. To do this, in the Guru admin, go to Dashboards and, in Customers, click on Filters. In this field, you can adjust the period you wish to view, using predefined intervals or selecting the desired date.
- How does the Dashboard handle customers who made more than one purchase in the period?
The customer is counted only once in the quantity indicators (such as current, active, new, or old customers), but all purchases made by them are considered in the calculations of average ticket and sales volume.
- Are refunded customers included in the indicators?
No. Only completed sales are considered. If a refund is processed, it no longer contributes to financial values, but the customer may still appear as current or active if they have other valid purchases in the period.
Access the Customers section to learn more about average sales per customer metrics.
Origin of accesses
In this section, you will find information on how the Customer Dashboard identifies where your customers come from.
- What are the origins in the Customer Dashboard?
The Sources section shows where active and old customers came from within the selected period, grouping them according to the traffic source recorded at the time of purchase.
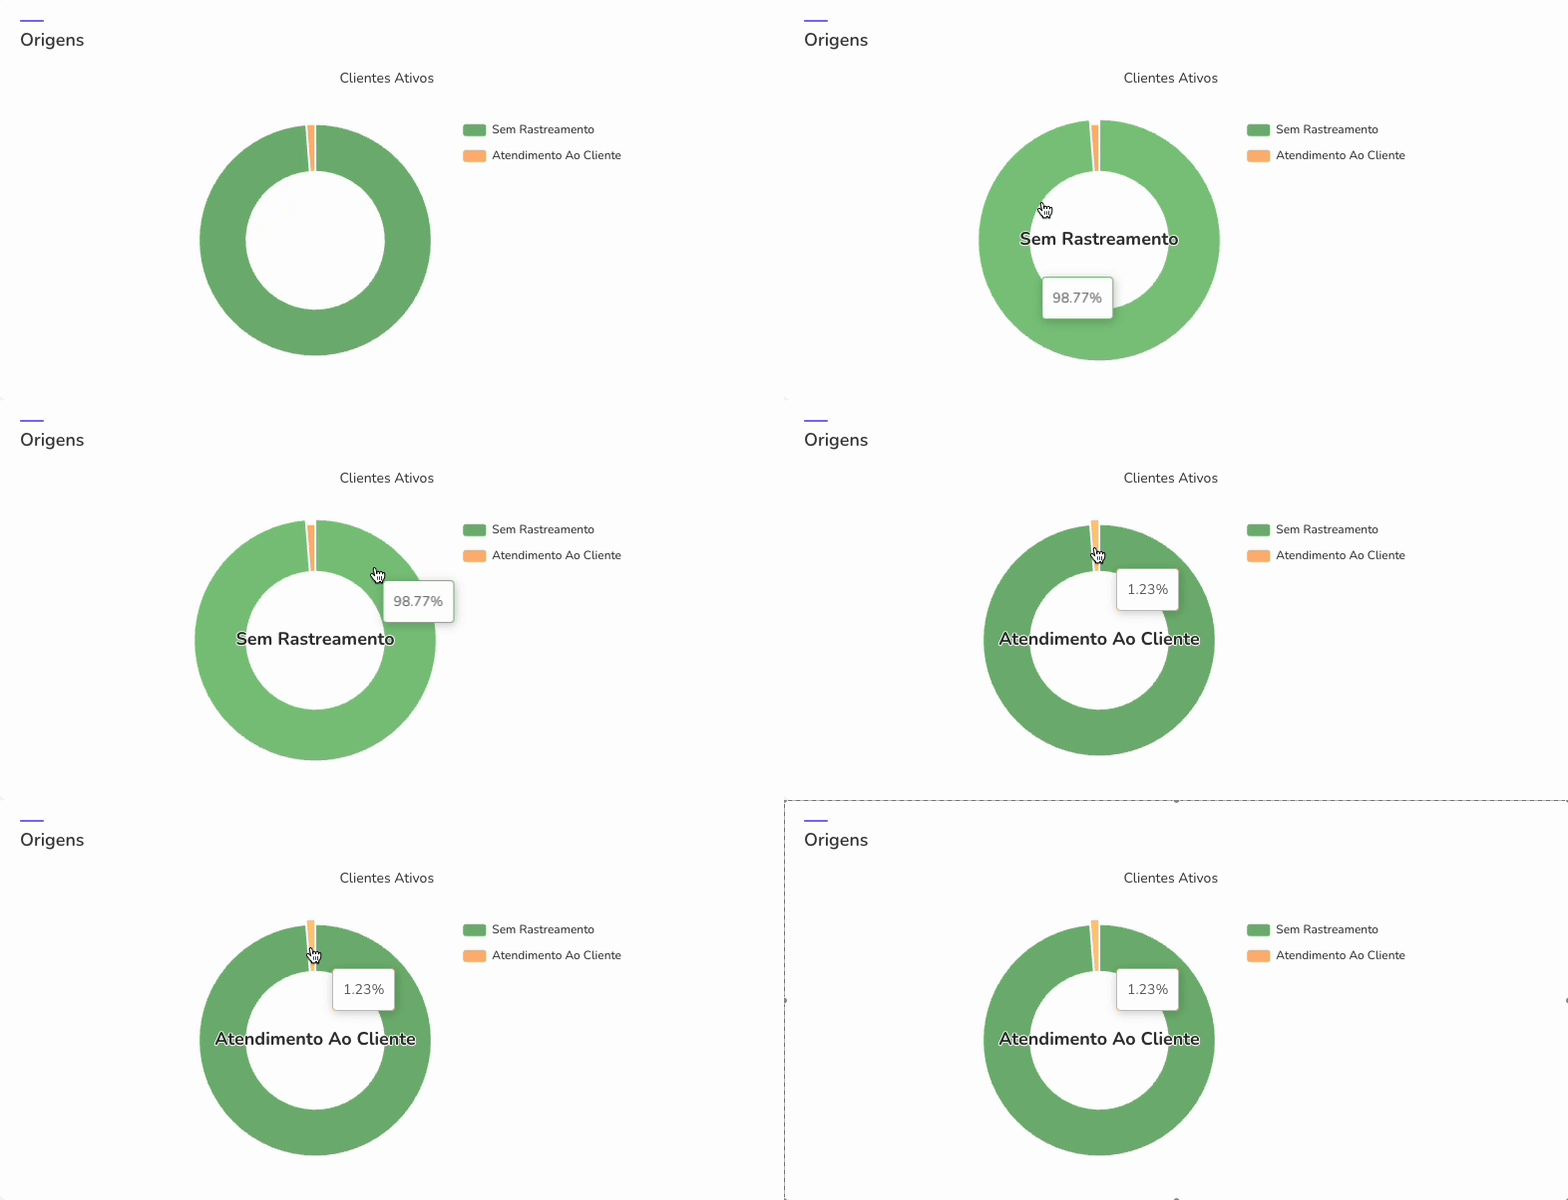
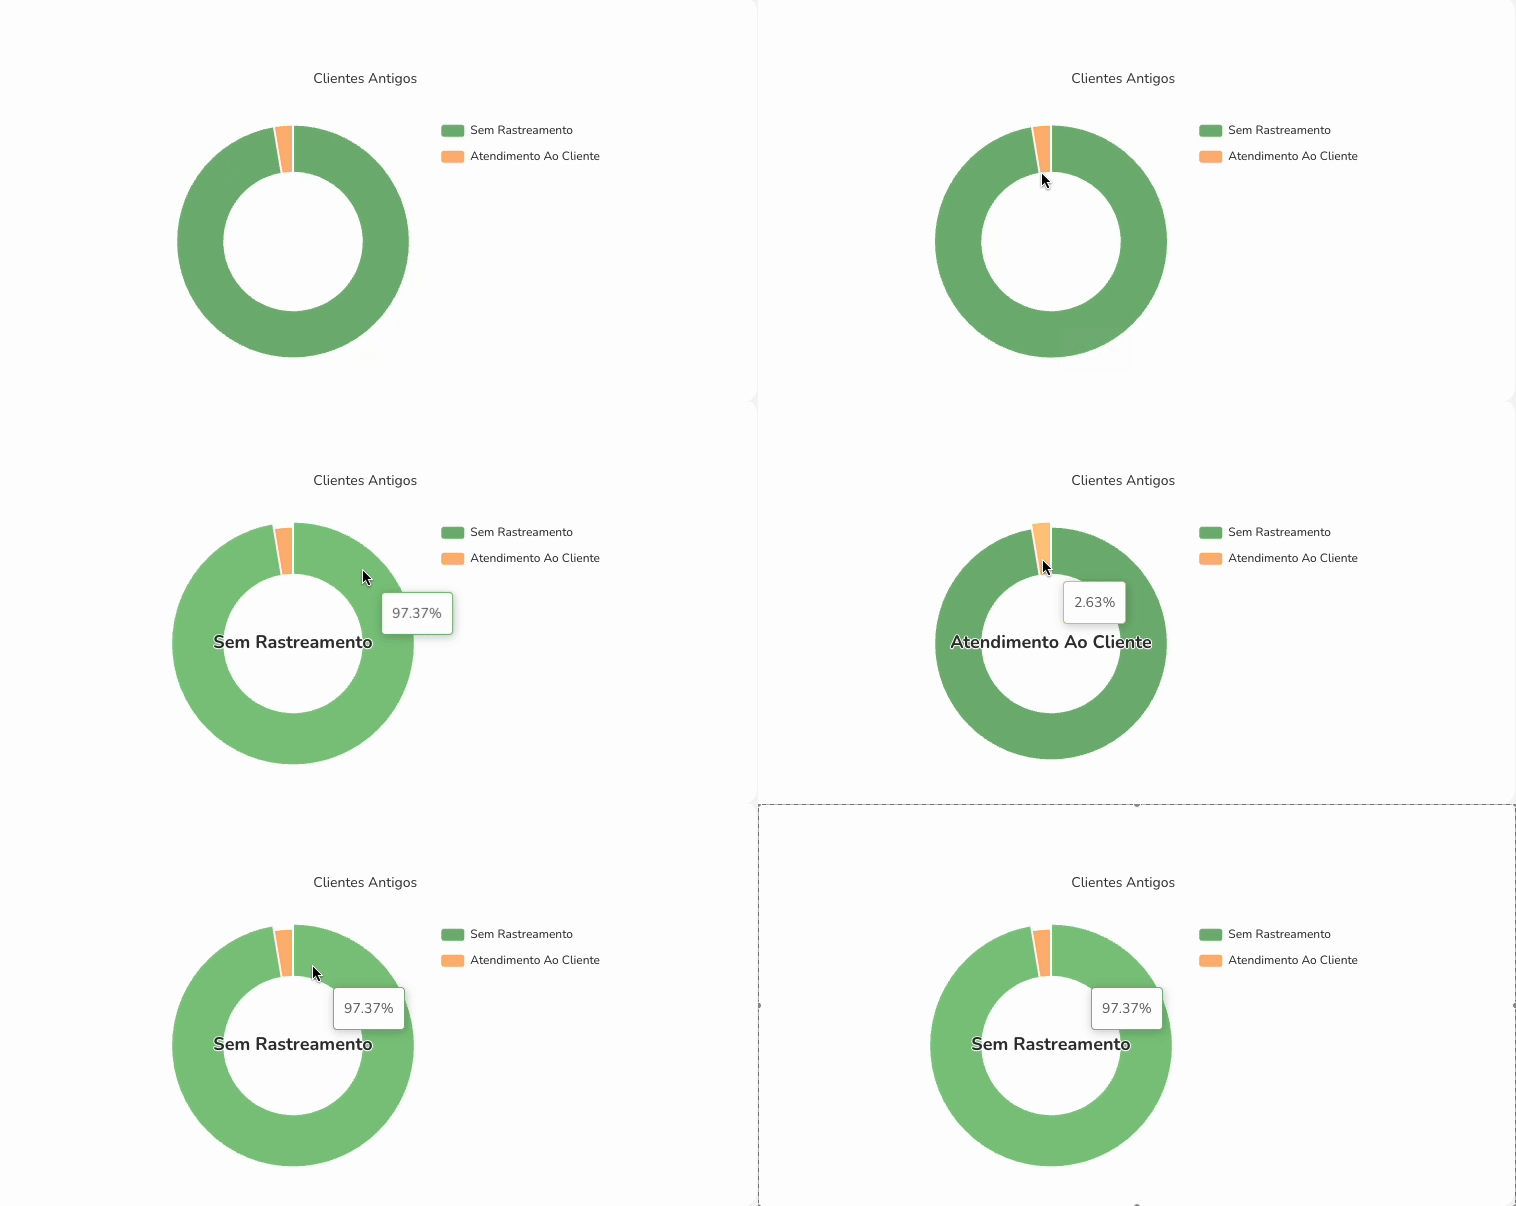
This origin is only identified when the sale occurs through a link with P.P.C.T. configured and active. If the sale does not go through a tracked link, the dashboard will display “no tracking”.
- What happens when tracking is not configured?
When the sale does not go through a link with P.P.C.T. configured and active, it is not possible to identify the origin of the access. In these cases, the Sources section will display the category “no tracking”, indicating that no traffic data was collected for that customer.
To learn more, access Sources in the Customer Dashboard metrics.
Payment preferences and settings
In the Payment Methods section, you will find answers on how the dashboard displays the payment methods used by customers and how to interpret this data.
- Why might a payment method not appear on the dashboard?
Only payment methods effectively used in completed sales during the selected period are displayed. If there are no transactions with a specific method, it will not be listed.
it is possible to filter the dashboard by period to view a subset of payment methods used in the selected interval.
- Are payment attempts considered in the dashboard?
No. Unapproved attempts do not impact graphs or metrics. Only completed sales are included in the payment method indicators.
Access Payment Methods in the Customer Dashboard metrics to learn more.
- What is the advantage of having more payment methods enabled in your checkout?
Having more payment methods¹ in the checkout increases conversion chances, as the customer can choose the option that best suits their reality.
By expanding the alternatives — such as card, bank slip, Pix, or digital wallets — you reduce barriers to completing the purchase, improve the user experience, and reach customer profiles with different preferences - this tends to increase sales volume and overall customer satisfaction.
Access and learn about the list of integrations available in Guru.